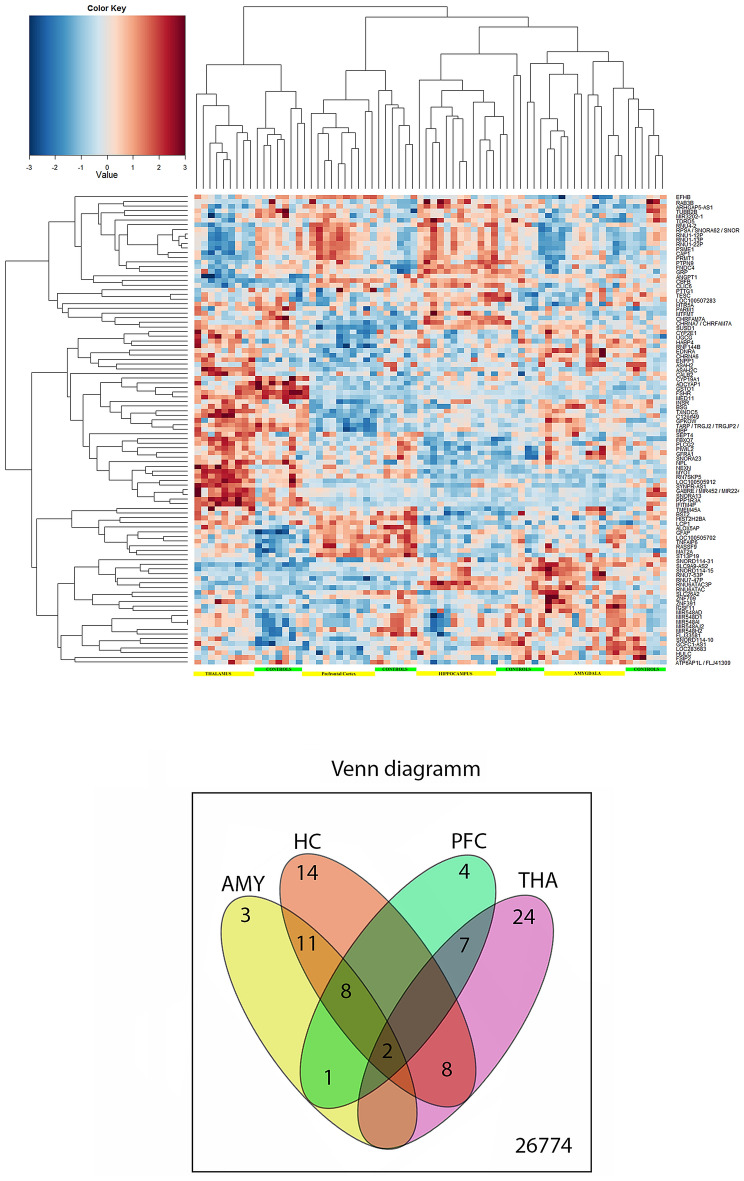
Figure 1.
(Upper panel): Heatmap of genes differentially expressed between amygdala, hippocampus, prefrontal cortex and thalamus of suicide completers and region-specific controls (automatically generated by the Affymetrix software). Scaled expression values are shown for each group with deep blue being the lowest and dark red the highest expression level. The depicted dendrograms cluster samples (top) and genes (left) employing average agglomeration and Euclidian distance measure. (lower panel): Venn diagram showing top suicide genes that were common or specific for a brain region. AMY, amygdala; HC, hippocampus; PFC, prefrontal cortex; THA, thalamus.

