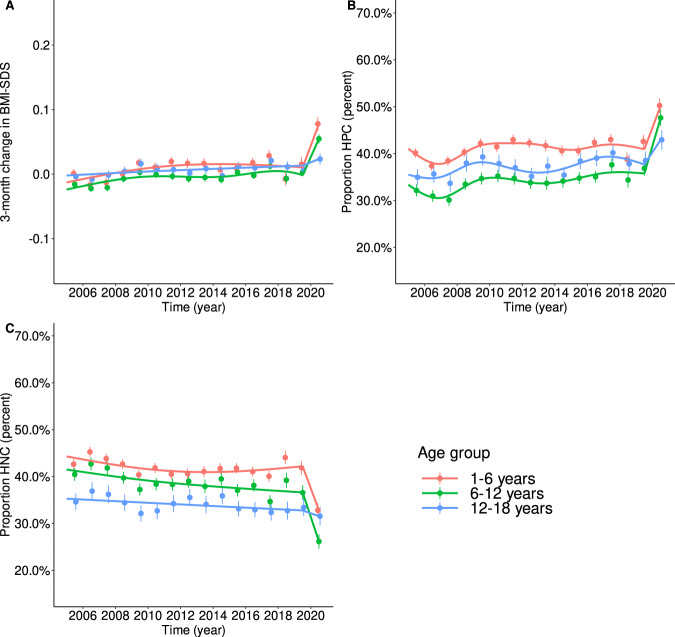
Fig. 1. Trends in ΔBMI-SDS, HPC, and HNC between 2005 and 2019 modeled via linear additive mixed models by age group.
A Trends in ΔBMI-SDS are shown as lines; points indicate yearly means ± 95% confidence levels. Between 2005 and 2019 (pre-pandemic), the trends were mainly stable, showing only a slight increase. From 2019 (prepandemic)to 2020 (after the onset of anti-pandemic measures), we found a substantial increase, less pronounced in the oldest age group. B The trends in the proportions of children with HPC show the same pattern as we found for ΔBMI-SDS. The patterns were also similar across the age groups but at higher levels for younger children. C Theinverse trends were found for the proportions of children with HNC. There was a small negative trend between 2005 and 2019. Between 2019 (pre-pandemic) and 2020, the proportions of children with HNC decreased substantially. The drop was less pronounced in the oldest age group.

