Figure 3.
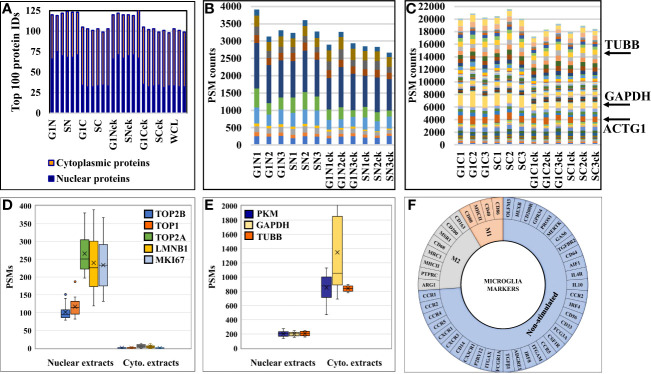
Charts representing the detection reproducibility of various protein marker categories in HMC3 cells. (A) Nuclear enrichment process outcome. The number of proteins with nuclear association in the top 100 most abundant proteins from the dataset is shown. Due to dual cellular component assignments, the sum of the nuclear and cytoplasmic proteins in the nuclear cell extracts exceeds 100. (B) Nuclear barcode proteins (11) displaying stable PSMs in the various nuclear enriched cell fractions (51). (C) Cytoplasmic barcode proteins displaying stable PSMs in the various cytoplasmic cell fractions. Beta tubulin (TUBB), glyceraldehyde 3-phosphate dehydrogenase (GAPDH) and cytoplasmic actin gamma 1 (ACTG1) are classical cytoplasmic marker proteins. (D) Abundance of nuclear markers in the nuclear and cytoplasmic cell fractions (topoisomerases-TOP1, TOP2A and TOP2B; lamin B1-LMNB1; and proliferation marker protein-MKI67). (E) Abundance of cytoplasmic markers in the nuclear and cytoplasmic cell fractions (TUBB, GAPDH, pyruvate kinase isozymes M1/M2-PKM). (F) Sunburst chart of microglia marker proteins associated with immune-activation and cytokine signaling processes.

