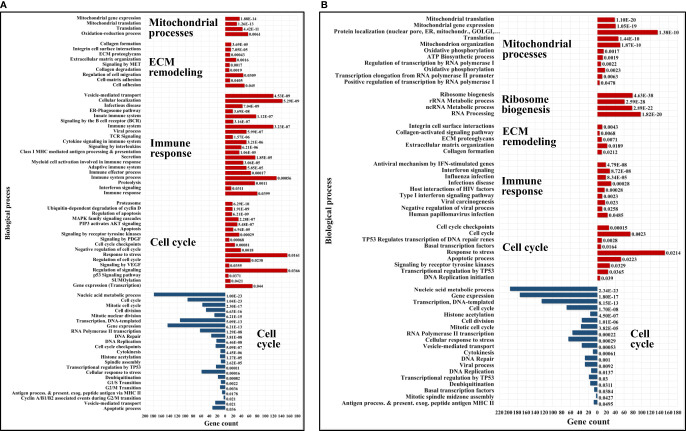
Figure 8.
Bar charts of selected enriched up- (red) and down- (blue) regulated biological processes and pathways in cytokine-treated vs non-treated HMC3 cells. (A) G1ck vs G. (B) Sck vs S. Annotations are based on BP, KEGG and Reactome databases. Full lists of enriched categories are provided in Supplemental Table 5.

