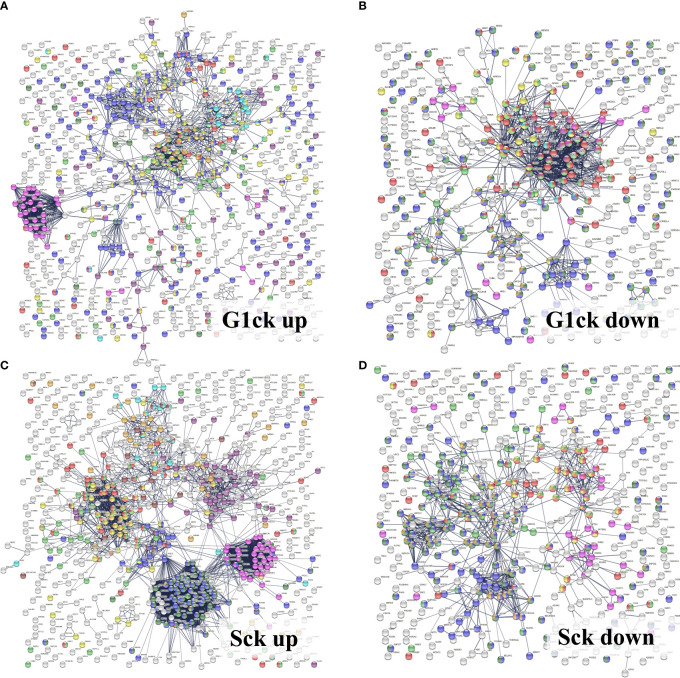
Figure 9.
STRING PPI networks representing up- and downregulated biological processes in cytokine-treated vs. non-treated HMC3 cells. (A) Upregulated G1ck vs. G1 (728)/Details provided in Figure 10: Magenta-Mitochondrial gene expression (translation) (36); Purple-Oxidation reduction process (60); Yellow-Immune system process (127); Red-Regulation of cell cycle (63); Green-Proteolysis/phagosome pathway/FCERI mediated NFKB activation (74); Turquoise-ECM organization (27); Blue-Transport/vesicle mediated transport (228); Dark yellow-MAPK family signaling (33); Dark green-Regulation of cell migration (44). (B) Downregulated G1ck vs G1 (403): Red-Cell cycle (94); Green-Chromosome organization (82); Blue-Gene expression/transcription (144); Yellow-DNA repair (35); Dark green-Transcription DNA templated (113); Dark yellow-Transcription RNA pol II (40); Purple-M phase (23); Turquoise-S phase (13); Magenta-Membrane trafficking (24). (C) Upregulated Sck vs S (714): Magenta-Mitochondrial gene expression/translation (mitochondrial ribosomes) (41); Purple-Mitochondrial organization/oxphos, ATP biosynthesis, respiratory electron transport (51); Dark green-Ribosome biogenesis (79); Blue-RNA processing, rRNA/ncRNA (98); Yellow-Viral processes/Interferon signaling (51); Red-Cell cycle (74); Green-Chromosome organization (67); Turquoise-ECM organization (22); Dark yellow-PTMs (69); Brown-Signaling by RTK/cytoskeletal rearrangements, membrane organization, integrin cell surface interactions (28). (D) Downregulated Sck vs S (465): Red-Cell cycle (69); Green-Chromosome organization (77); Blue-Gene expression/transcription (174); Yellow-Mitotic cell cycle process (36); Dark green-Transcription DNA templated (125); Dark yellow-RNA polymerase transcription II; (56) Magenta-Membrane trafficking (35). See also Supplemental File 2 for enlarged images and gene descriptions.

