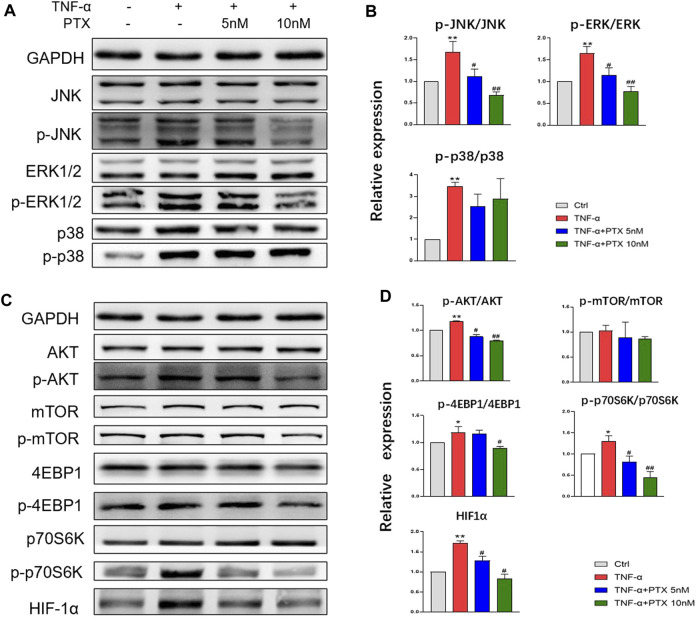
FIGURE 4.
PTX suppresses the activation of the MAPK and AKT/mTOR pathways. (A–B) MH7A cells were treated with TNF-α and PTX (5 and 10 nM). The protein expression levels of p38, ERK1/2, and JNK and the corresponding phosphorylated proteins were examined by western blotting. (C–D) MH7A cells were treated with TNF-α and PTX (5 and 10 nM). The protein expression levels of phosphorylated/total AKT, mTOR, p70S6K, 4EBP1, and HIF-1α were examined by Western blot analysis. Data are expressed as mean ± SD (n = 3). * p < 0.05, ** p < 0.01 vs Ctrl group. # p < 0.05, ## p < 0.01 vs TNF-α group.

