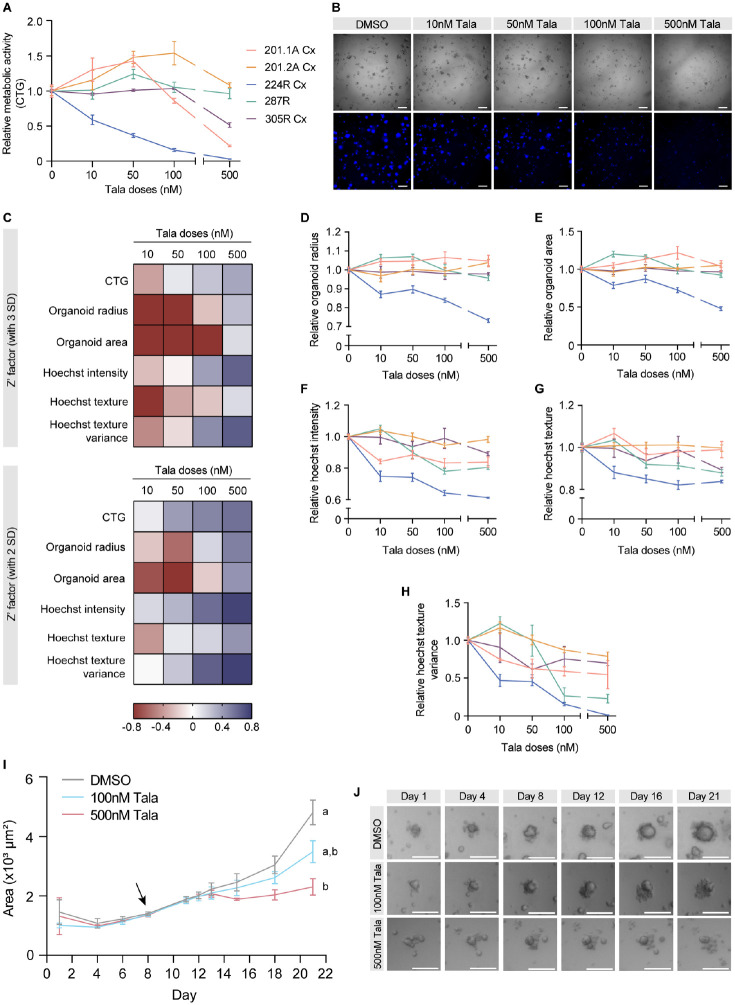
Figure 3.
Comparison of talazoparib responses of organoids from diverse phenotypes of prostate cancer. (A) Relative metabolic activity, as measured by CTG, in 201.1A-Cx (red), 201.2A-Cx (yellow), 224R-Cx (blue), 287R (green), and 305R-Cx (purple) organoids in increasing doses of talazoparib (n = 5). (B) Representative images of brightfield microscopy and Hoechst staining of 224R-Cx organoids treated for 12 d with vehicle or increasing doses of talazoparib. Scale bars = 500 µm. (C) Heat map summarizing the Z′ factor for each readout (CTG, organoid radius, area, Hoechst intensity, texture, and texture variance) in increasing doses of talazoparib. Z′ factors were calculated by using either three (top) or two (bottom) standard deviations in the formula. (D–H) Dose-response curves of organoids generated from measurements of (D) radius, (E) area, (F) Hoechst intensity, (G) texture, and (H) texture variance. Dose-response curves for each organoid treated with talazoparib were normalized to their respective negative control (DMSO). (I) Graph showing the mean area of 224R-Cx organoids treated with DMSO, 100 nM talazoparib, or 500 nM talazoparib over 21 d. The arrow indicates the first day of treatment (day 8). Data are mean ± SEM. ap < 0.001, statistical analysis of change in organoid area across time within each treatment group; bp < 0.001, statistical analysis of organoid area within each treatment group compared with vehicle control; two-way analysis of variance with Dunnett’s post hoc test. (J) Representative images of a single organoid treated with DMSO, 100 nM talazoparib, or 500 nM talazoparib over 21 d. Scale bars = 250 µm. Imaging measurements represent well-level averages, and all data are mean ± SEM. CTG = CellTiter-Glo; SD = standard deviation; Tala = talazoparib.

