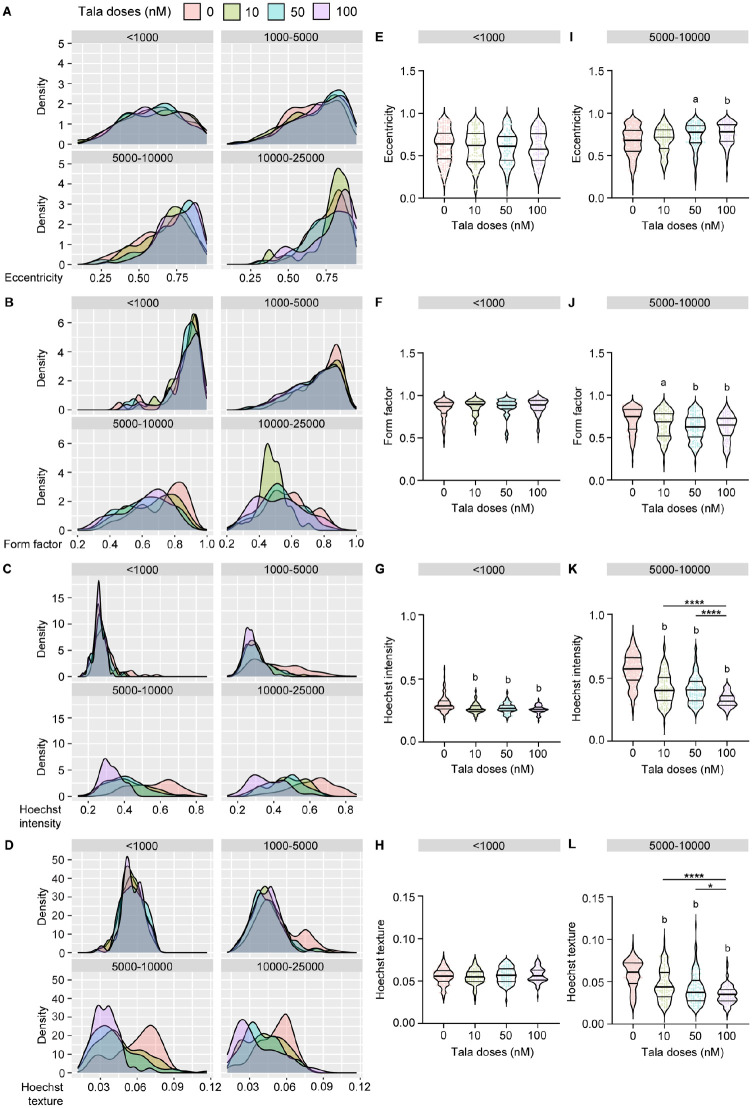
Figure 6.
Single organoid analyses show that talazoparib alters the morphology and composition of PARP inhibitor–sensitive organoids. Untreated and treated 224R-Cx organoids were divided into four groups based on their area: <1000 µm2, 1000 to 5000 µm2, 5000 to 10,000 µm2, and 10,000 to 25,000 µm2. (A–D) Density plots showing the change in distribution of (A) eccentricity, (B) form factor, (C) Hoechst intensity, and (D) texture values in organoids after treatment compared with vehicle control in each group. (E–H) Violin plots of the (E) eccentricity, (F) form factor, (G) Hoechst intensity, and (H) texture values in organoids after treatment compared with vehicle control in <1000 µm2 organoids. (I–L) Violin plots for the (I) eccentricity, (J) form factor, (K) Hoechst intensity, and (L) texture values in organoids after treatment compared with vehicle control in 5000 to 10,000 µm2 organoids. Each dot denotes an individual organoid from n = 15 (DMSO) or n = 5 wells (talazoparib). ap < 0.01; bp < 0.0001, statistical analysis of organoid measurements compared with vehicle control. *p < 0.05, ****P < 0.0001; one-way analysis of variance with post hoc Tukey’s test. PARP = poly ADP-ribose polymerase; tala = talazoparib.

