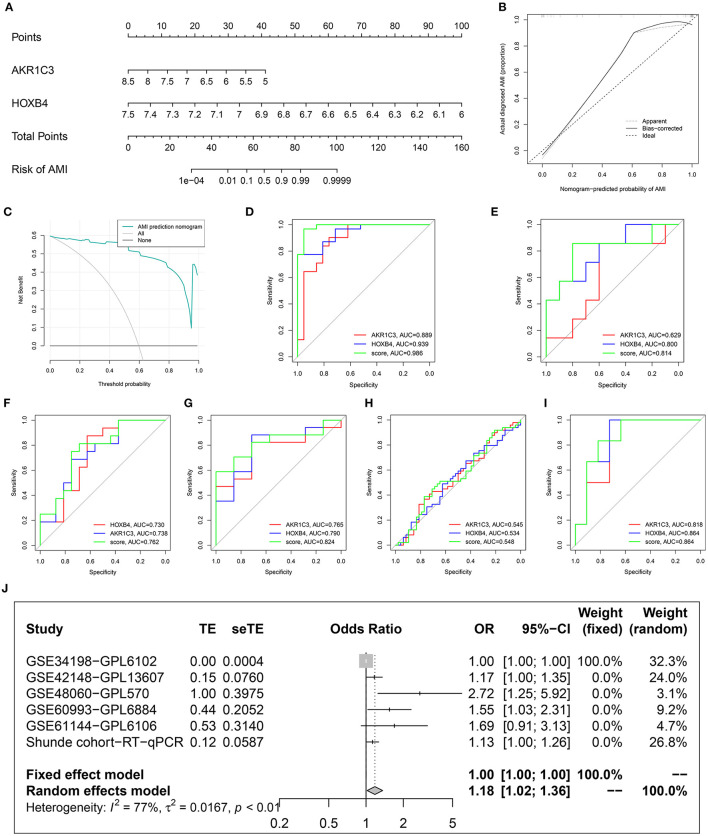
Figure 7.
Construction and validation of a diagnostic model. (A) The established nomogram. (B) Calibration plot. (C) Decision curve analysis. (D–I) Receiver operating characteristic analysis in GSE48060 (D), GSE61144 (E), Shunde cohort (F), GSE60993 (G), GSE34198 (H), and GSE42148 (I). (J) Meta-analysis.

