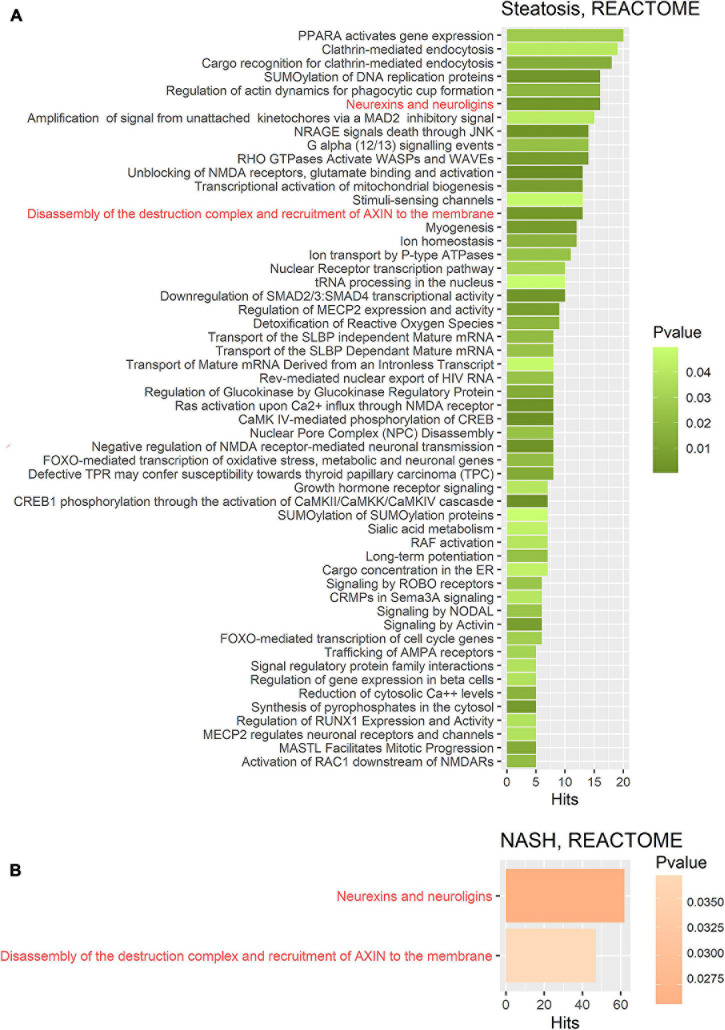
FIGURE 5.
Gene set enrichment analysis performed on the REACTOME metabolic pathway database on two gene sets. (A) Target gene set of miRNA that were significantly deregulated in the group of patients with steatosis (p ≤ 0.05); (B) Target gene set of miRNA that were significantly deregulated in the group of patients with NASH (p ≤ 0.05). The common pathways in steatosis and NASH are highlighted in red. Hits—number of target genes represented in the pathway.

