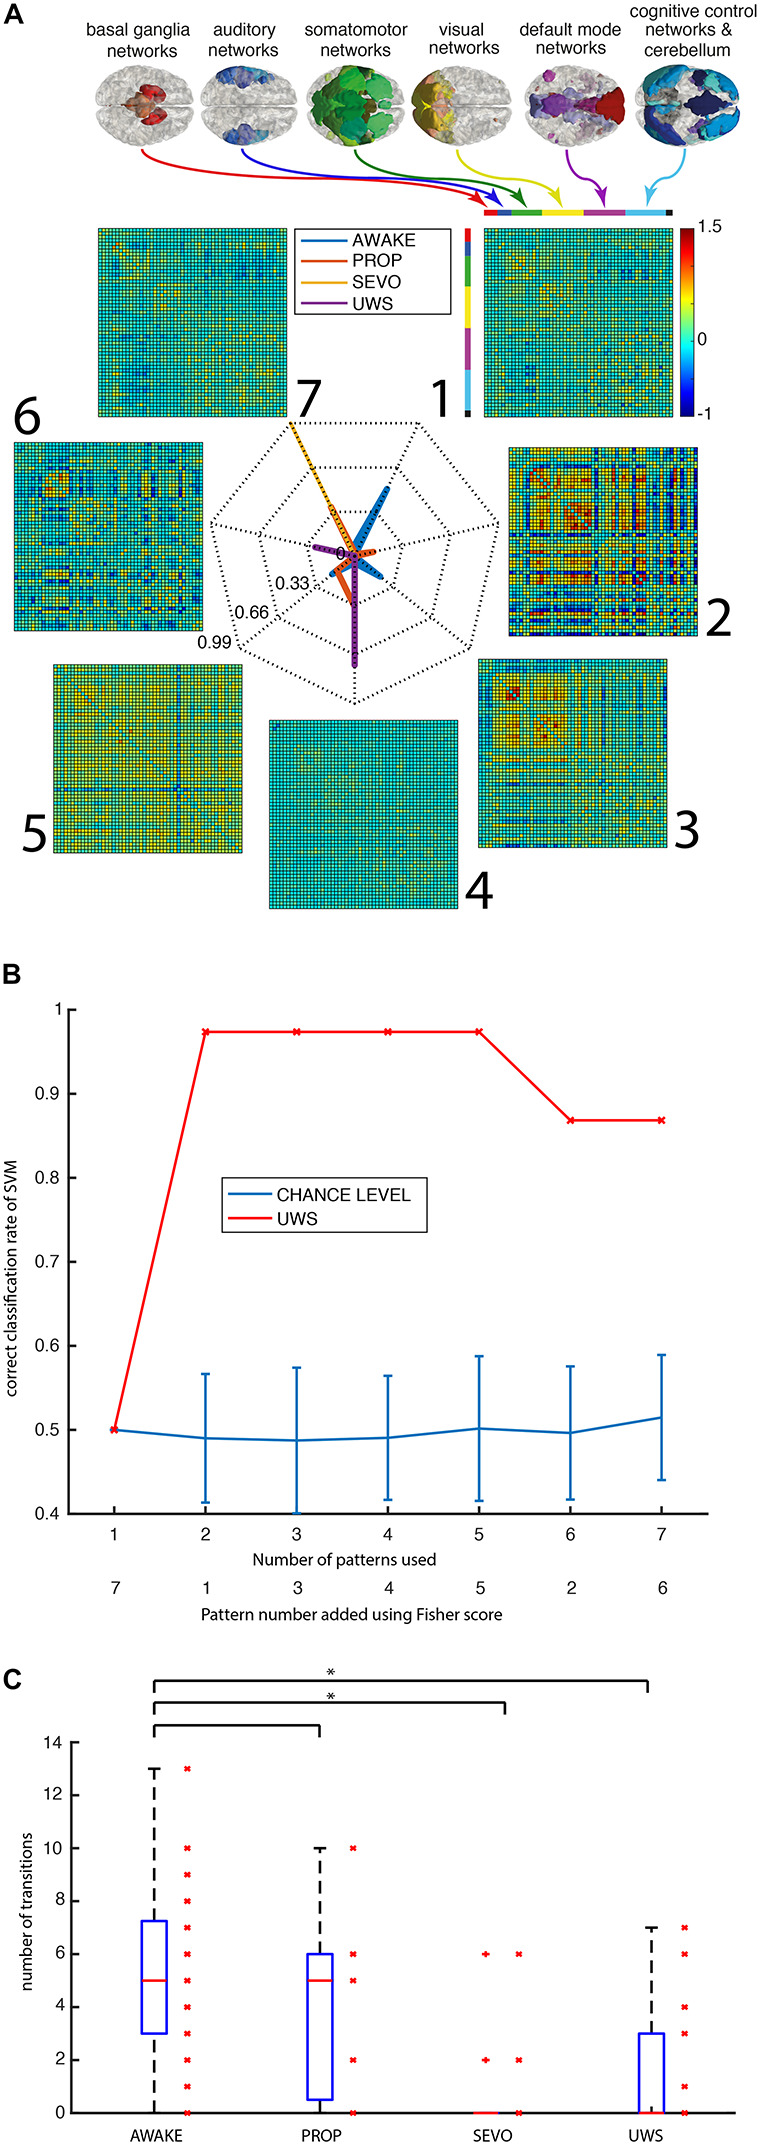
FIGURE 2.

Patterns are specific for intact consciousness. (A) Individual data points of the pattern matrices arise from different groups of functional networks: basal ganglia, auditory, somatomotor, visual, default mode, cognitive control, and cerebellar networks. The radar plot shows the patterns 1–7 and their relative distribution of appearance in the different groups (AWAKE in blue, PROP in red, SEVO in yellow, and UWS in purple). (B) Correct classification rate of a support vector machine trained in anesthesia data and tested on the subjects with UWS (n = 19) and 19 controls (red) vs. chance level in a random assignment of groups and 100 repetitions (blue with standard errors). (C) An absolute number of transitions between patterns in the four groups. (*p < 0.05, Mann–Whitney test, uncorrected).
