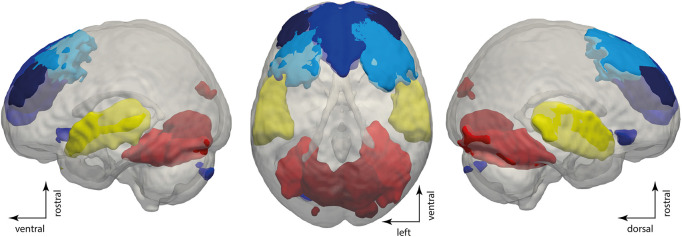
FIGURE 4.
Specific network activity is related to the appearance of conscious-related patterns. Rendering showing the dorsolateral and dorsomedial prefrontal cortices in blue, primary auditory cortices in yellow, and visual cortices in red. The rendering shows maps of the independent components with a threshold of p < 0.05 family-wise error correction in SPM12.

