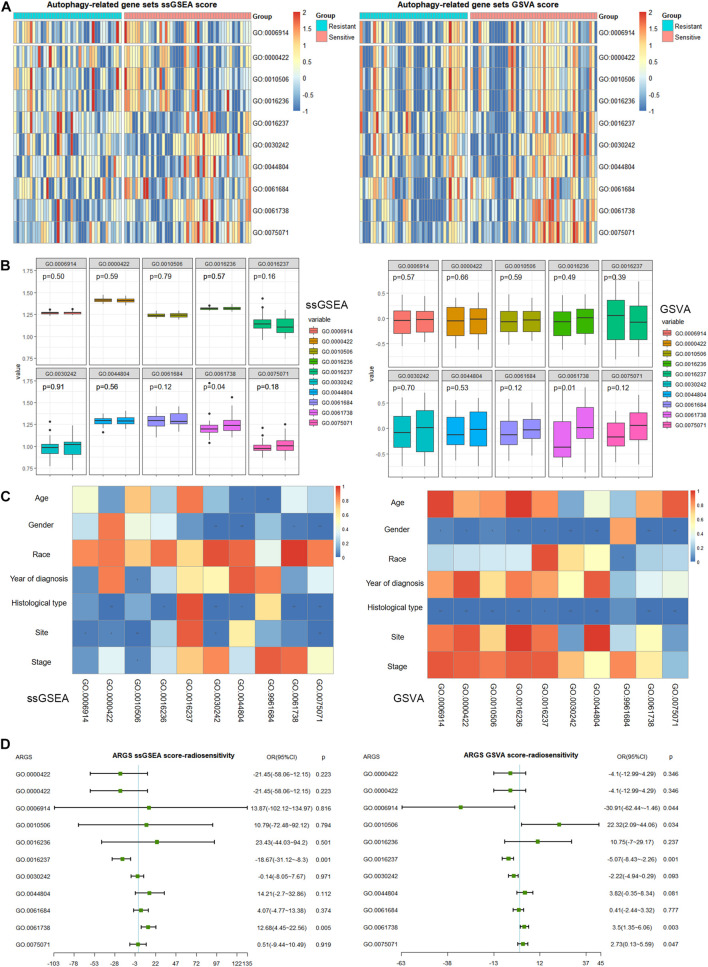
FIGURE 2.
Clinical correlation of autophagy-related gene sets (ARGSs) score by ssGSEA and GSVA methods. (A) The distribution of ARGSs score in radiotherapy resistant and sensitive groups. (B) The differential analysis of ARGSs score between radiotherapy resistant and sensitive groups. The left is radiotherapy resistant group while the right is radiotherapy sensitive group. (C) The correlation analysis of ARGSs and clinicopathologic factors. (D) Multivariate logistic regression analysis of ARGSs with radiotherapy responses.

