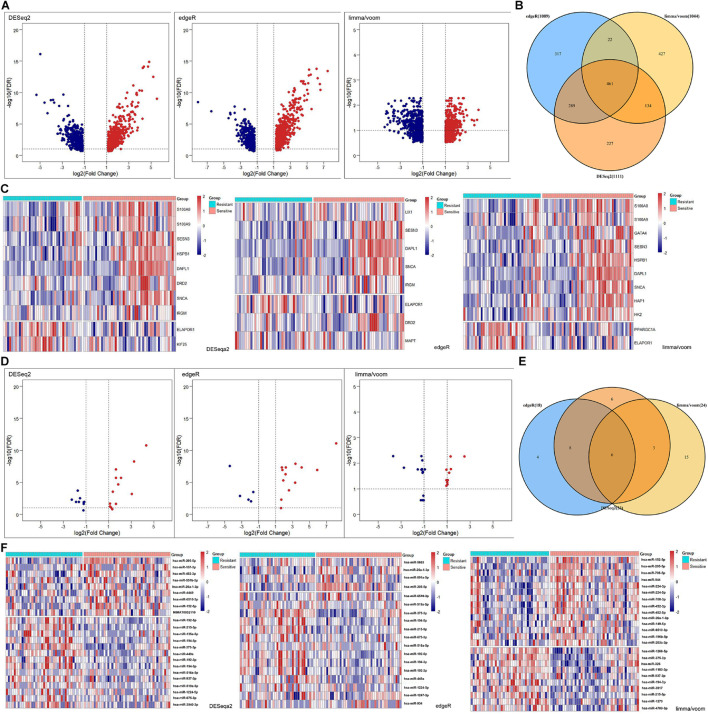
FIGURE 3.
Differentially expressed (DE) analysis of mRNAs and miRNAs between rediotherapy resistant and sensitive groups. (A) Volcano plots of DEmRNAs by DESeq2, edgeR, and limma/voom. (B) Venn diagram of common DEmRNAs. (C) Heatmaps of DEARmRNAs. (D) Volcano plots of DEmiRNAs by DESeq2, edgeR, and limma/voom. (E) Venn diagram of common DEmiRNAs. (F) Heatmaps of DEmiRNAs. Red represents upregulated genes and blue indicates downregulated genes.

