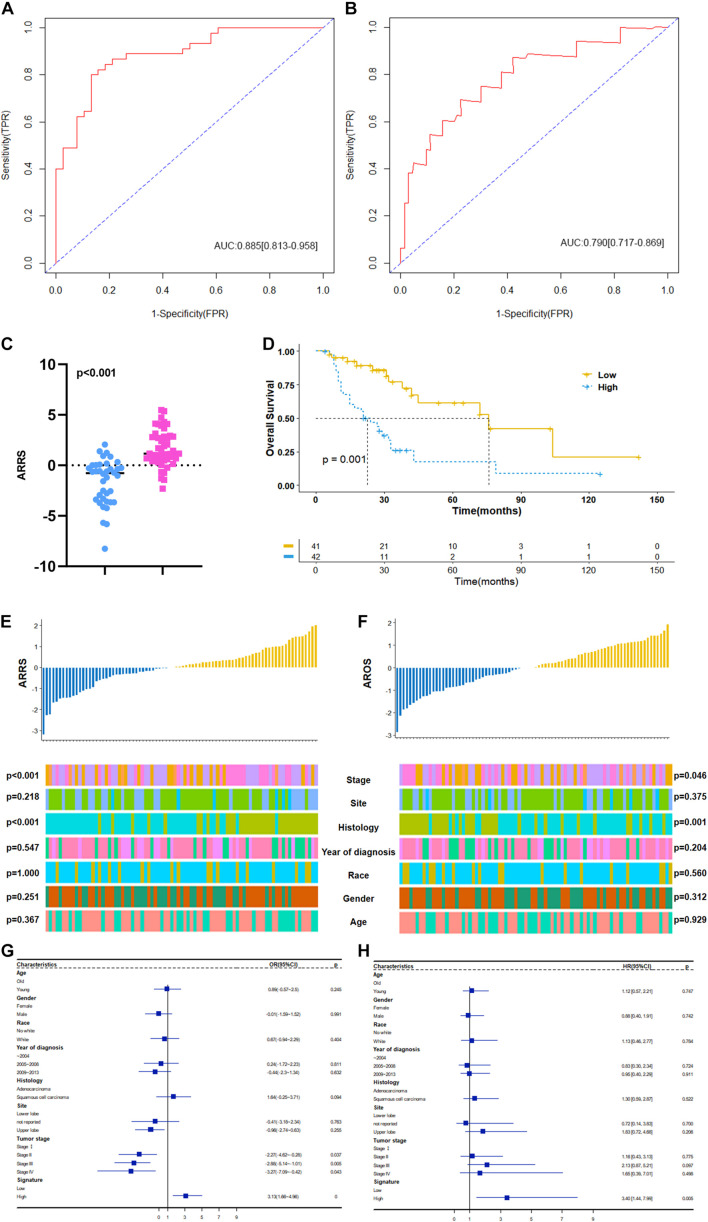
FIGURE 6.
Construction and clinical correlation analysis of autophagy-related prognostic risk signature. (A) The receive operator curve (ROC) analysis for autophagy-related radiosensitivity risk signature (ARRS). AUC: Area Under Curve, FPR: false positive rate, TPR: true positive rate. (B) The ROC analysis for autophagy-related overall survival risk signature (AROS). (C) The distribution of ARRS between rediotherapy resistant and sensitive groups. Blue represents radiotherapy resistant group and pink indicates radiotherapy sensitive groups. (D) The Kaplan-Meier survival curve grouping by high- and low- AROS. The median survival time were indicated by dashed line. (E) The correlation analysis of ARRSs and clinicopathologic factors. (F) The correlation analysis of AROSs and clinicopathologic factors. (G) Multivariate logistic regression analysis of ARRSs with radiotherapy sensitivity. (H) Multivariate Cox regression analysis of AROSs with overall survival.

