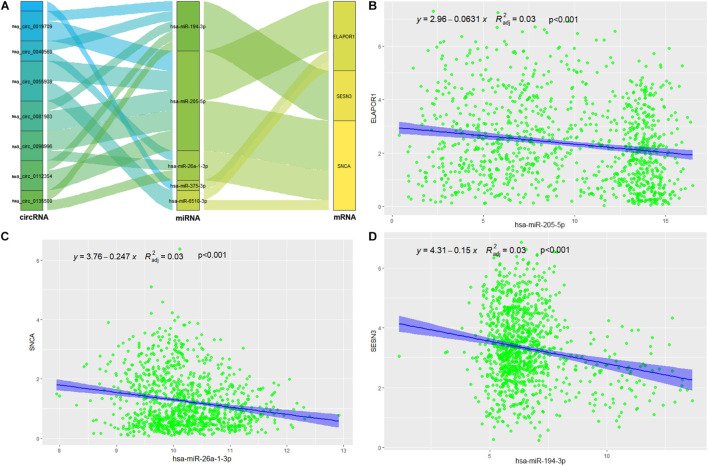
FIGURE 8.
Construction and correlation analysis of the ceRNA network. (A) The alluvial diagram of regulatory network of ceRNA. (B) Correlation analysis between has-miR-205-5p and ELAPOR1. (C) Correlation analysis between has-miR-26-1-3p and SNCA. (D) Correlation analysis between has-miR-194-3p and SESN3.

