Figure 6.
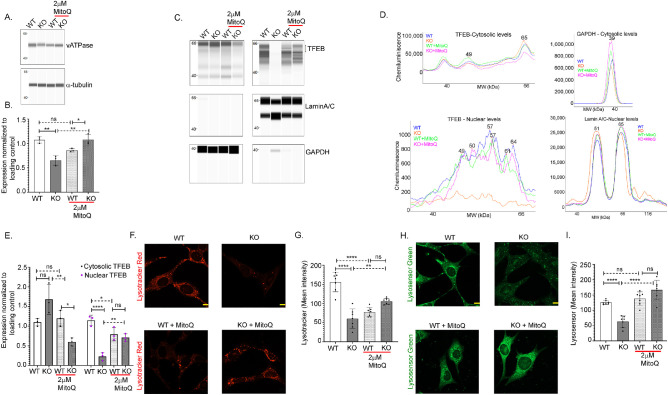
MitoQ improves lysosomal function in MCEC KO cells. (A) Wes immunoassay of v-ATPase from WT and KO Slc4a11 MCEC ± MitoQ treatment. (B) Quantification of panel A data, n = 3. (C) Wes immunoassay of TFEB, Lamin A/C, and GAPDH from Slc4a11 WT and KO MCEC cytosolic and nuclear fractions. (D) Electropherograms of Wes immunoassay from panel C showing the size and intensities of the bands in C. (E) Quantification of panel C data, n = 3. (F) Comparison of lysosome numbers (Lysotracker Red-DND 99) in Slc4a11 WT and KO MCEC, scale bar – 10 µm. (G) Quantification of panel F data, n = 7. (H) Comparison of lysosomal pH (Lysosensor Green -DND 189) in Slc4a11 WT and KO ± MitoQ, Scale bar – 10 µm. (I) Quantification of panel H data, n = 7. *P < 0.05, **P < 0.01, ***P < 0.001, ****P < 0.0001, mean ± SD (1-way ANOVA with Tukey's multiple comparisons).

