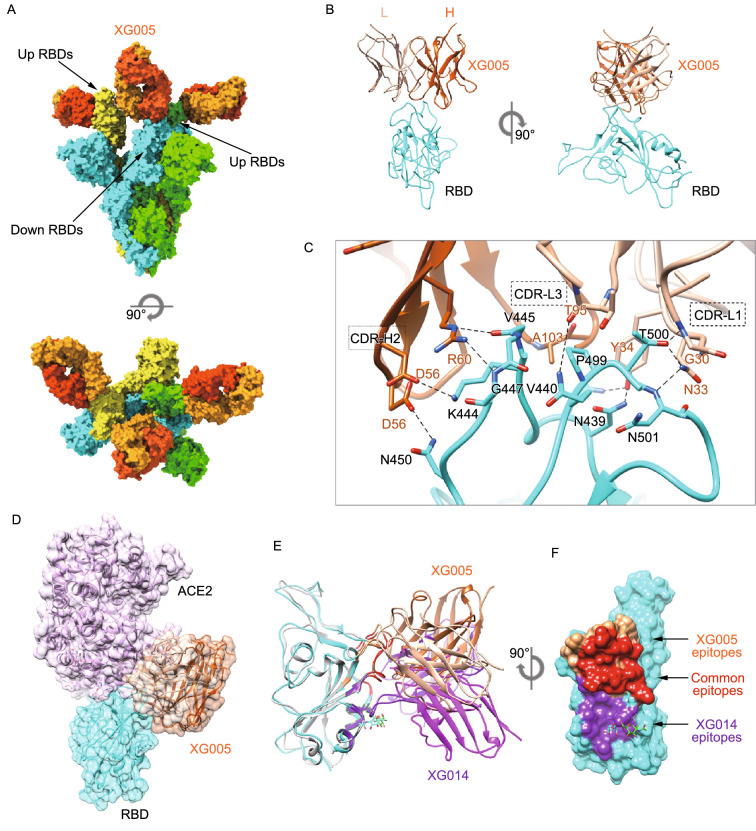
Figure 6.
Cryo-EM structure of SARS-CoV-2 S trimer complexed with XG005. (A) Molecular surface representation of the SARS-CoV-2 S-XG005 complex structure with three RBDs “down”, viewed along two orthogonal orientations. Each SARS-CoV-2 protomer is colored distinctly (cyan, green and yellow). The XG005 light and heavy chains are colored light orange and dark orange, respectively. (B) Cartoon representation of XG005-RBD regions. (C) Key interactions between XG005 and SARS-CoV-2 RBD. Hydrogen bonds are represented by dashed lines. (D) Positioning of ACE2 (pink) relative to the XG005 bound to SARS-CoV-2 RBD. (E) Comparison of XG014-RBD (XG014: purple; RBD: light gray) and XG005-RBD (XG005: orange; RBD: cyan) structures. (F) Molecular surface representation of the SARS CoV-2 RBD (cyan), showing the difference and similarity of XG005 and XG014 epitopes. The common residues involved in both XG005 and XG014 interactions are colored red. The specific residues involved in XG005 or XG014 binding are colored orange or purple, respectively

