Figure 5.
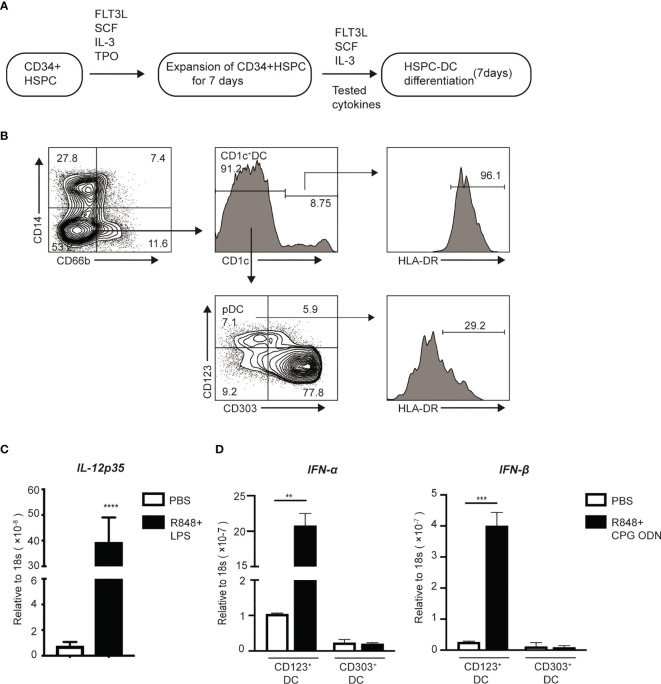
In vitro induction of DCs from HSPCs. (A) Workflow for the induction of HSPC-DCs. (B) Flow cytometry of pDCs (CD66b-CD14-CD1c-CD123+CD303-) and CD1c+cDCs (CD66b-CD14-CD1c+) populations after 14 days of induction from CD34+HSPCs. On day 14, (C) After stimulated with the TLR4 and TLR7 agonists for 2 hours, mRNA of FACS sorter purified CD1c+cDCs was extracted to measure gene expression using real time RT-PCR. (D) CD123+pDCs and CD303+pDCs were highly purified using FACs sorter. Then both populations were stimulated with the TLR7 and TLR9 for 2 hours, mRNA was collected to measure gene expression using real time RT-PCR. Error bars indicate mean ± SD. **P < 0.01; ***P < 0.001; ****P < 0.0001.

