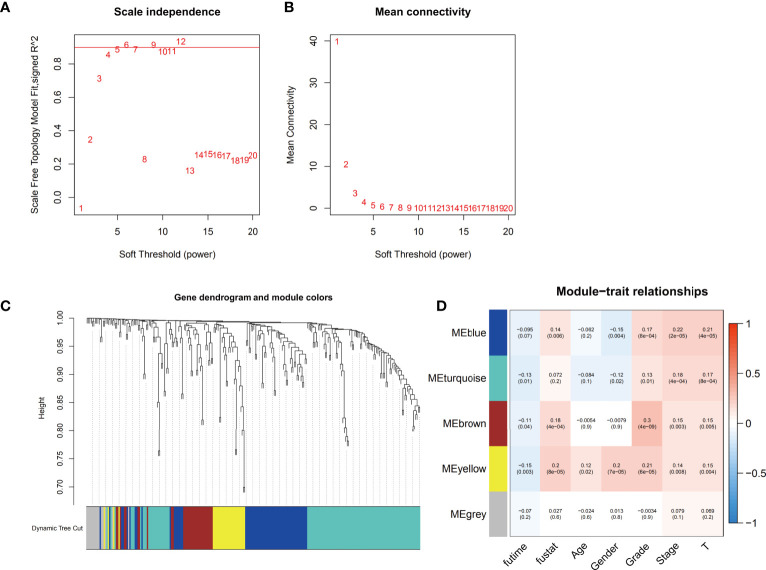
Figure 2.
Identification of the weighted gene coexpression network analysis (WGCNA) hub module and assessment of module-trait relationships. (A, B) Soft threshold selection to identify the WGCNA module. (C) The cluster dendrogram of 5 colored modules based on a dissimilarity measure (1-TOM) in HCC patients. (D) Correlation between the gene module and clinical traits, including survival time (futime), vital status (fustat), age, gender, grade, stage and T stage.

