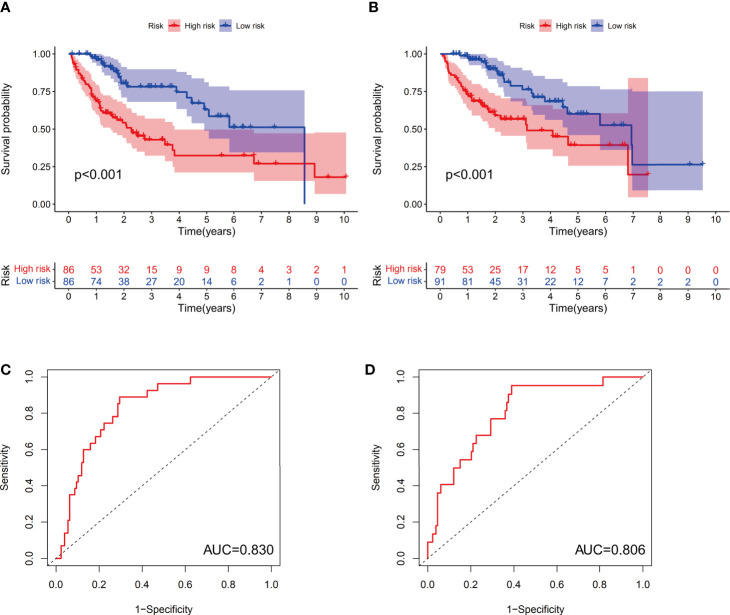
Figure 4.
The predictive value of the prognostic model in both the training and test groups. Kaplan-Meier curves were depicted based on the ferroptosis-related signature scores in the training group (A) and test group (B). The receiver operating characteristic (ROC) curves of 1-year survival for HCC patients in the training group (C) and test group (D).

