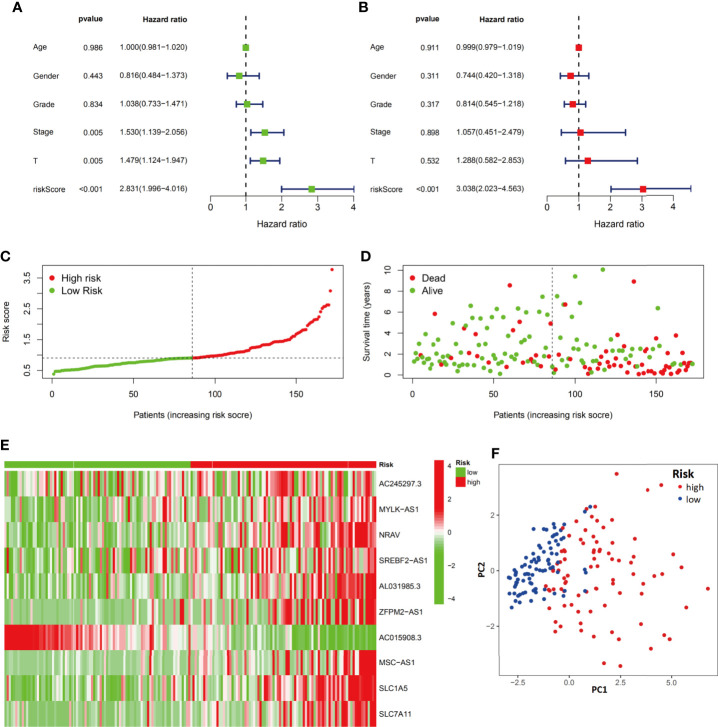
Figure 5.
Evaluation of the ferroptosis-related signature in the training group. Independent prognostic effects of the risk score model were assessed by univariate Cox regression analysis (A) and multivariate Cox regression analysis (B). High- and low-risk group risk score rank (C), survival status distribution (D), expression of ferroptosis-related signature (E) and principal component analysis (PCA) plots (F).

