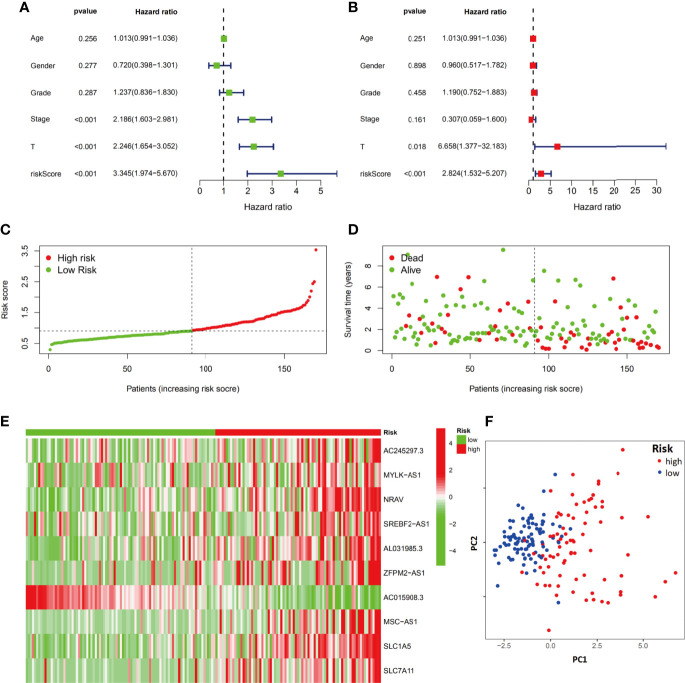
Figure 6.
Evaluation of the ferroptosis-related signature in the test group. The independent prognostic value of the risk score model was assessed by univariate Cox regression analysis (A) and multivariate Cox regression analysis (B). Risk score rank (C), survival status distribution (D), ferroptosis-related signature component expression (E) and PCA plots (F) for the high- and low-risk groups.

