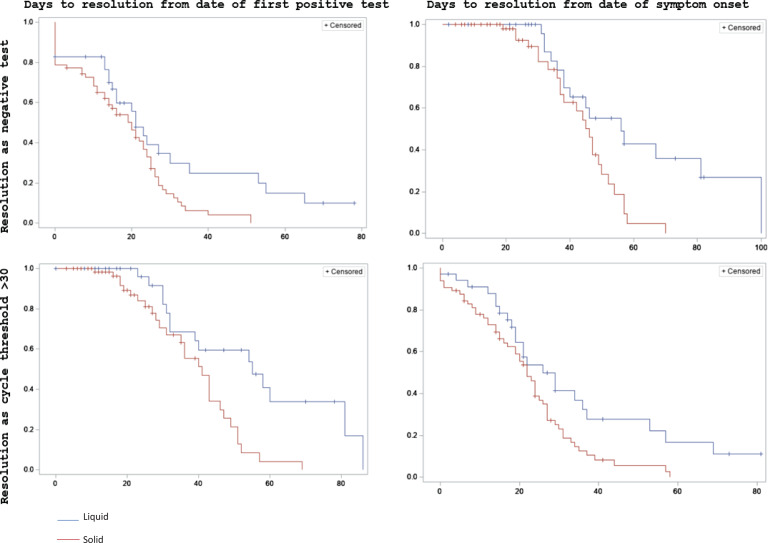
Fig. 1.
Kaplan-Meier product-limit survival estimates for time to SARS-CoV-2 resolution in patients with cancer. Plots show survival estimates using different definitions of infection onset (date of first positive test vs date of symptom onset) and resolution (negative result versus cycle threshold >30). The x-axes show days from onset to resolution and y-axes show probabilities of resolution. Patients with solid tumors are represented in red and patients with hematologic tumors are represented in blue.

