Figure 1.
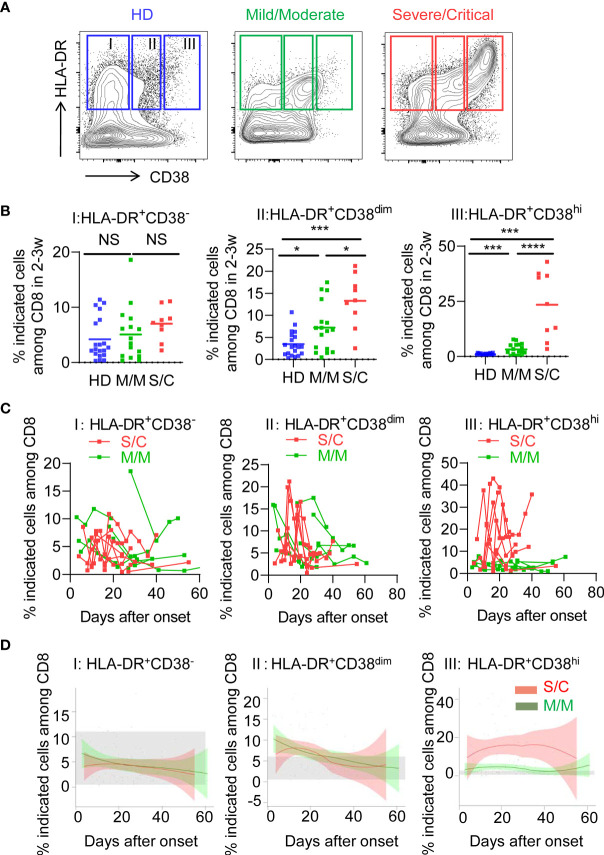
Elevated HLA-DR+CD38hi CD8+ T cells during acute infection of COVID-19. Flow cytometry analysis of HLA-DR and CD38 expression was performed on PBMCs collected from healthy donors, M/M and S/C patients with COVID-19 infection. (A) Representative FACS contour plots showed three subpopulations of HLA-DR+ CD8+ T cells from healthy donor and COVID-19 patients: HLA-DR+CD38− (I), HLA-DR+CD38dim (II), HLA-DR+CD38hi (III). (B) Scatter dot plots of the three percentages of HLA-DR+ CD8+ T cells from healthy donors and COVID-19 patients within 2–3 weeks post onset (n = 9–20 each group). P Values were obtained by unpaired two-tailed Student’s t tests and Mann–Whitney U test and repeated measures by one-way ANOVA or Kruskal-Wallis test followed by Tukey’s or Dunn’s multiple comparisons test. *P < .05, **P < .01, ***P < .001, ****P < .0001. (C) Longitudinal data of three subpopulations were graphed for eight S/C and seven M/M patients with three time points at least. (D) Temporal changes of three subpopulations in M/M (n =32) and S/C (n = 10) groups during hospitalization were shown. The 95% confidence interval indicated by colored areas. The normal range of each population was gray shaded region.

