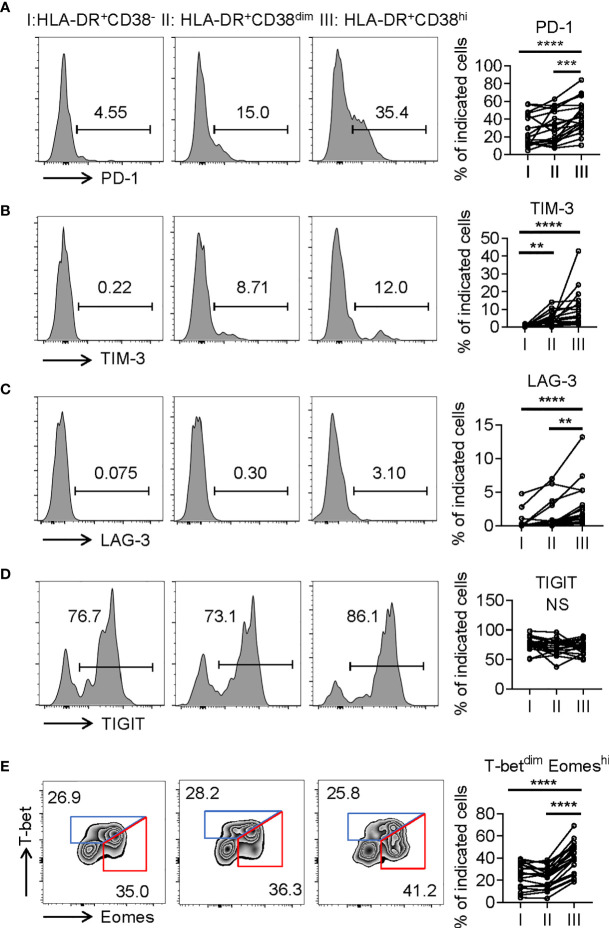
Figure 4.
HLA-DR+CD38hi CD8+ T cells displayed phenotypic and transcriptional state of exhaustion. (A–D) Flow cytometry analysis of expression of PD-1 (A), TIM3 (B), LAG3 (C), and TIGIT (D) on the three CD8+ T population (I, II, III) from COVID-19 patients (n = 20). Representative histograms (left) and plots (right) were shown. (E) Representative flow data (left) and dot plots (right) of percentage of T-betdimEomeshi and T-bethiEomesdim cells among I, II, III from COVID-19 patients (n = 20). P Values were obtained by paired two-tailed Student’s t tests and repeated measures by one-way ANOVA test followed by Holm-Sidak’s multiple comparisons test. **p < .01, ***p < .001, ****p < .0001.

