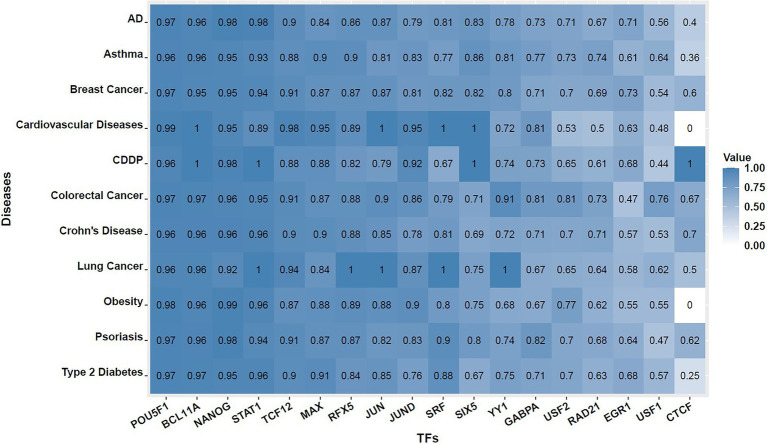
Figure 2.
Heat maps showing percentage of discordant SNVs across 18 TFs and 11 complex diseases. That is, among all SNVs that overlap with putative TF binding sites identified by PWM at GWAS-identified disease loci, what proportion of them has insignificant deltaSVM scores. The value shown inside each cell is the percentage of discordant SNVs found for the TF and disease combination.

