FIGURE 1.
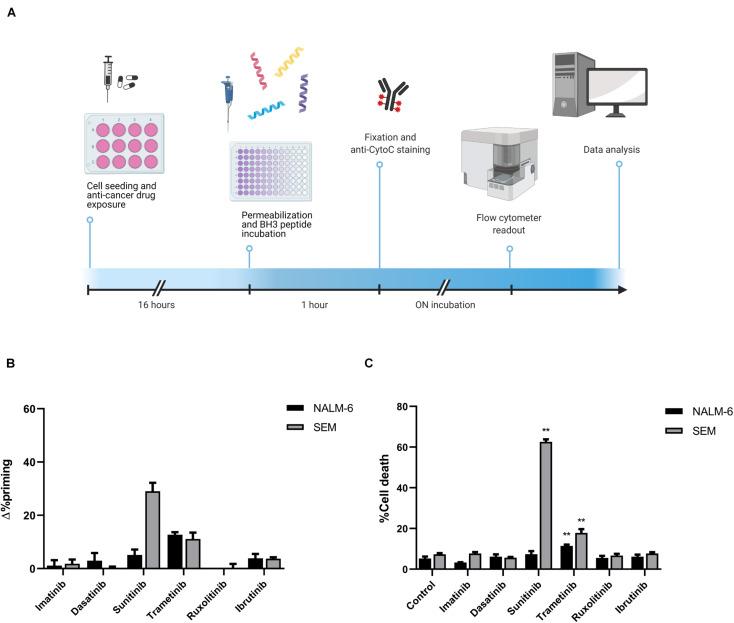
Cytotoxicity induced by targeted drugs in BCP-ALL cell lines. (A) Graphical scheme of the DBP technique where cancer cells are plated and treated for 16 h. After drug exposure, cells are plated in 96-well plates and exposed to the different BH3 peptides. After 1 h, cells were fixed and stained with an anti-Cytochrome C antibody overnight. Finally, analyses were performed using a flow cytometer for drug-response curves. Designed with BioRender.com. (B) DBP with BIM BH3 peptide after 16 h of incubation with 1,000 nM imatinib, 100 nM dasatinib, 1,000 nM sunitinib, 100 nM trametinib, 100 nM ruxolitinib, and 1,000 nM ibrutinib in NALM-6 and SEM cell lines. Δ%priming stands for the difference in %priming between treatment and control conditions. (C) Cytotoxicity expressed as percentage of dead cells after 72 h of treatment with the same therapies assessed by Annexin V/DAPI staining. All results are expressed as the mean ± standard error of the mean (SEM) of at least three biologically independent replicates. Statistical significance was calculated using Student’s t-test comparing to control condition and considering *p < 0.05 and **p < 0.01.

