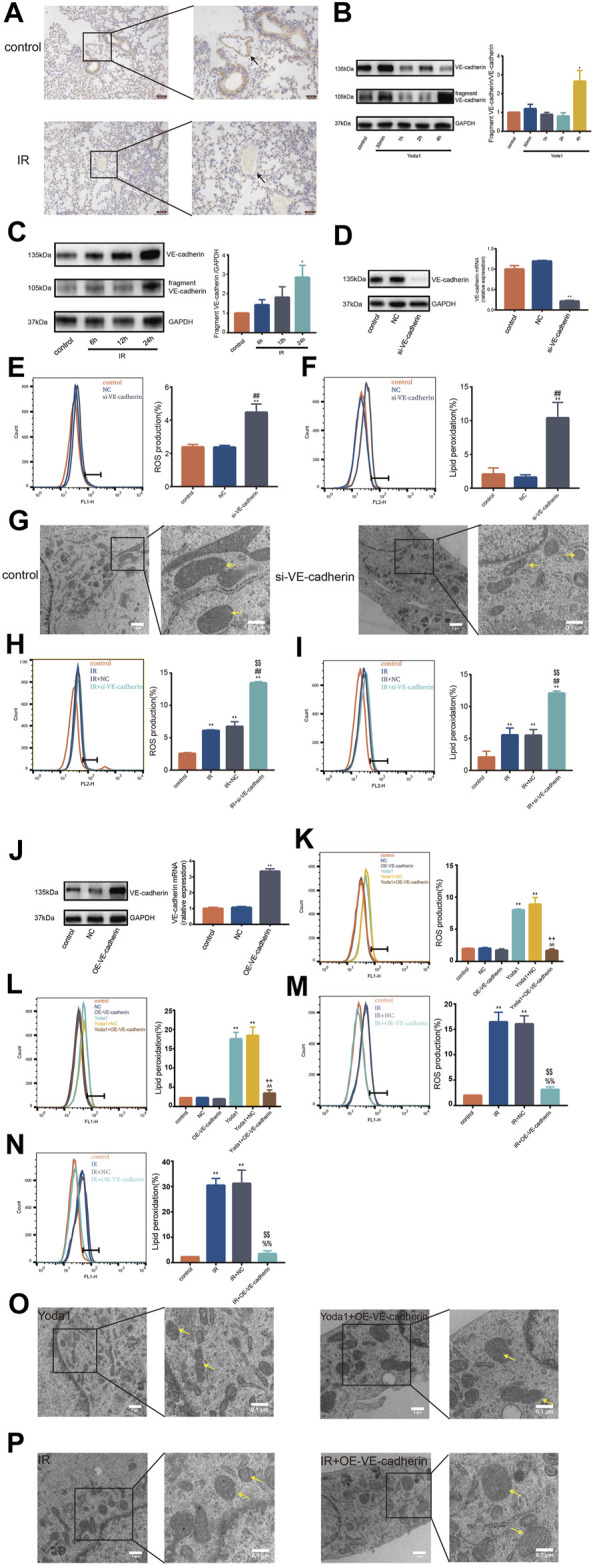
FIGURE 4.

VE-cadherin contributes to the ferroptosis-inducing effect of PIEZO1 (A) Expression of VE-cadherin detected by immunohistochemistry assay in lungs of mice 24 h after exposure to 15-Gy of ionizing radiation (IR) or no radiation. Scale bars: 100 µm (left) and 50 µm (right) (B) Western blotting analysis of VE-cadherin and VE-cadherin fragment in HULEC-5a cell at 30 min, 1, 2 and 4 h after treatment with Yoda1. (C) Western blotting analysis of VE-cadherin and VE-cadherin fragment expression in HULEC-5a cell at 6, 12, and 24 h after exposure to IR or no radiation. (D) Western blot and RT-PCR analyses showing successful knockdown of VE-cadherin in HULEC-5a cells. (E) ROS measurement in HULEC-5a cells with knockdown of VE-cadherin. (F) Lipid peroxidation assessment in HULEC-5a cells with knockdown of VE-cadherin. (G) Transmission electron microscopy images of HULEC-5a cells with or without knockdown of VE-cadherin. (H) ROS measurement in HULEC-5a cells with knockdown of VE-cadherin subjected to IR or no radiation. The results are from the same batch of experiment shown in Figure 4E (I) Lipid peroxidation assessment in HULEC-5a cells with knockdown of VE-cadherin subjected to IR or no radiation. The results are from the same batch of experiment shown in Figure 4F (J) Western blot and RT-PCR analyses showing successful overexpression of VE-cadherin in HULEC-5a cells. (K) ROS measurement in HULEC-5a cells with overexpression of VE-cadherin with Yoda1 treatment. (L) Lipid peroxidation assessment in HULEC-5a cells with overexpression of VE-cadherin with Yoda1 treatment. (M) ROS measurement in HULEC-5a cells with overexpression of VE-cadherin with IR. The results are from the same batch of experiment shown in Figure 4K (N) Lipid peroxidation assessment in HULEC-5a cells with overexpression of VE-cadherin with IR. The results are from the same batch of experiment shown in Figure 4L (O) Transmission electron microscopy images of HULEC-5a cells with overexpression of VE-cadherin with Yoda1 treatment. (P) Transmission electron microscopy images of HULEC-5a cells with overexpression of VE-cadherin before IR. Data were plotted as means ± SEM. n = 3 independent repeats. **, p < 0.01 vs control; ##, p < 0.01 vs NC; %%, p < 0.01 vs IR; $$, p < 0.01 vs IR + NC (negative control; ^^, p < 0.01 vs Yoda1; ++, p < 0.01 vs Yoda1+NC).
