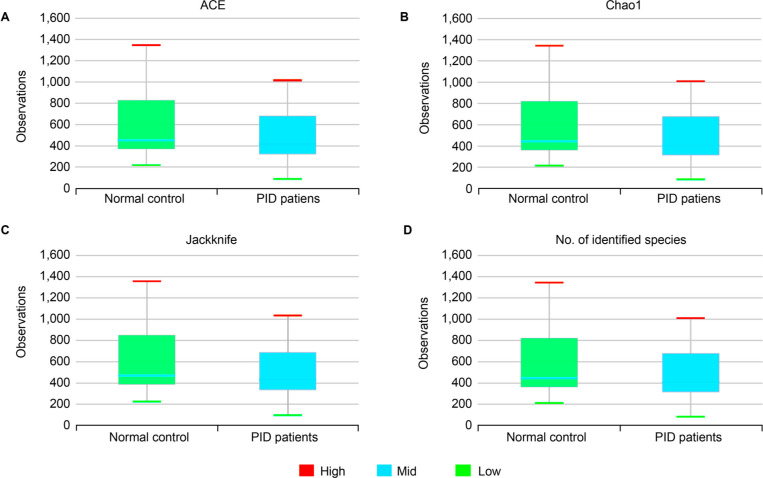
Fig. 2.
Boxplot of Species richness indices.
A) Ace (p = 0.274), B) Chao1 (p = 0.289), C) Jackknife (p = 0.267) indices and D) The number of OTUs (p = 0.299) reflects the diversity of OTU in samples. Bars indicate the median, and the hinges represent the lower and upper quartiles. In panels (A-D), no statistically significant differences were observed between the normal control women and PID patients. The Wilcoxon rank-sum test was used to determine the species richness.

