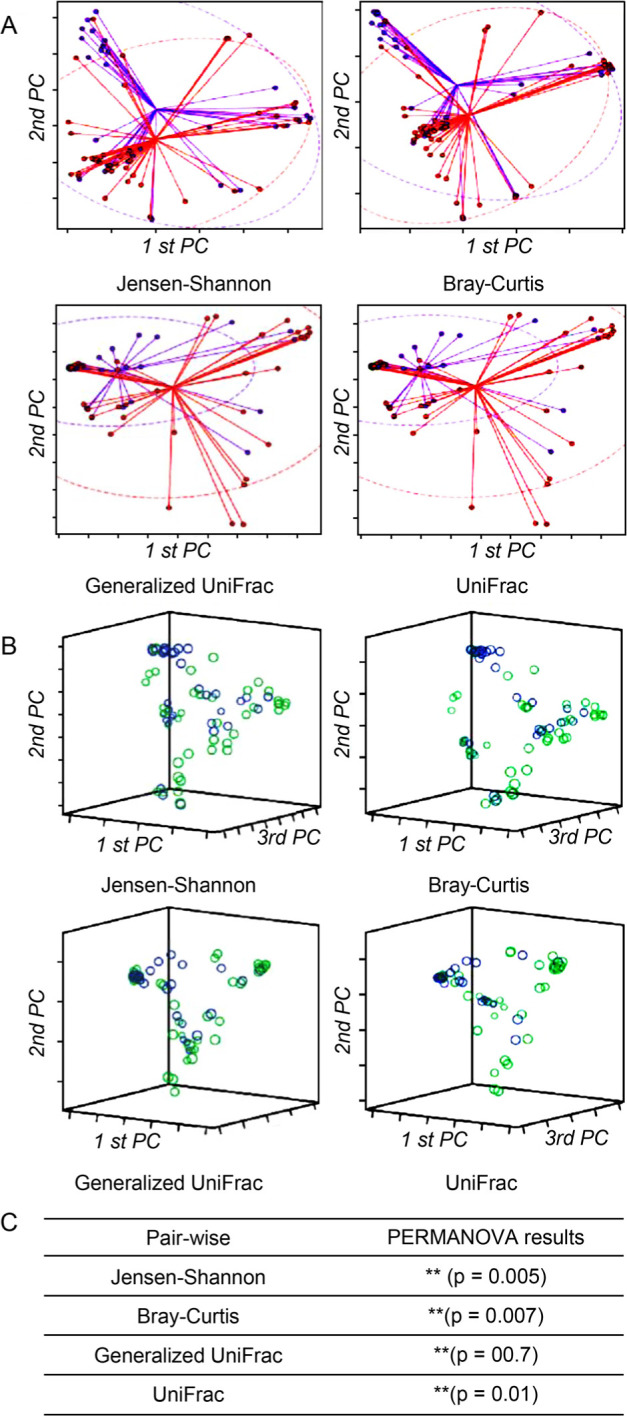
Fig. 4.

Beta diversity of microbial communities based on Jensen-Shannon divergence, Bray-Curtis, Generalized UniFrac, and UniFrac.
A) PCoA plots were produced as an ellipse in two dimensions based on a 95% confidence interval. B) PCoA plots were also presented in 3D. The blue/purple color indicates normal control women, and the light green/red color indicates PID patients, respectively. C) Permutational multivariate analysis of variance (PERMANOVA) results demonstrated the beta set-significance between the PID patient and normal control women groups. **p < 0.01.
