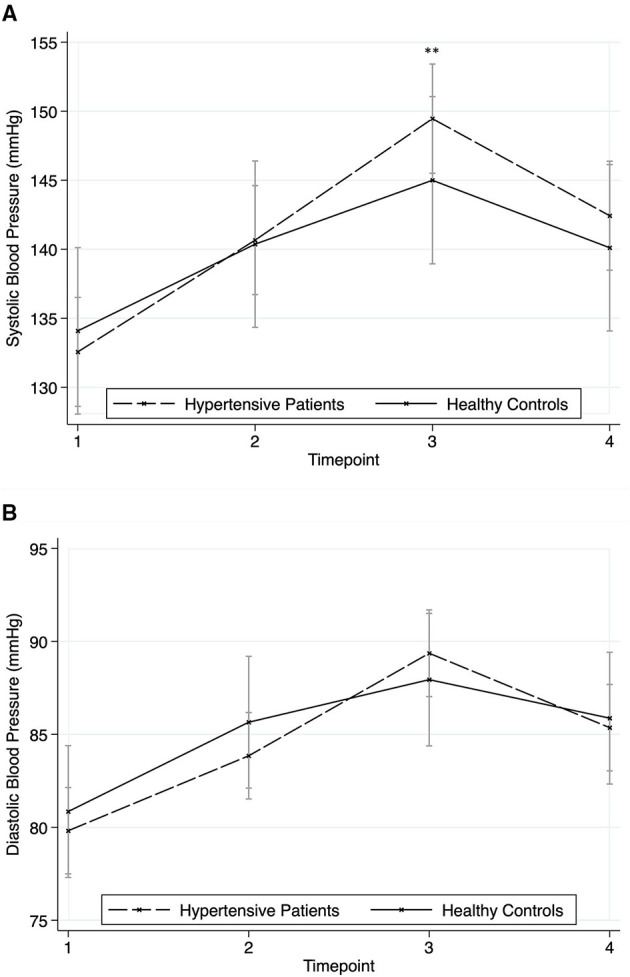
Figure 3.

Responses in blood pressure to the stressors for hypertensive patients and healthy controls (mean ± SD). Timepoint 1: rest; timepoint 2: Attachment Interview (Adult Attachment Projective Picture System); timepoint 3: Separation Recall; timepoint 4: recovery. (A) Systolic Blood Pressure. (B) Diastolic Blood Pressure. Asterisks indicate significant group*time differences related to healthy controls at reference timepoint 1 (**p < 0.01).
