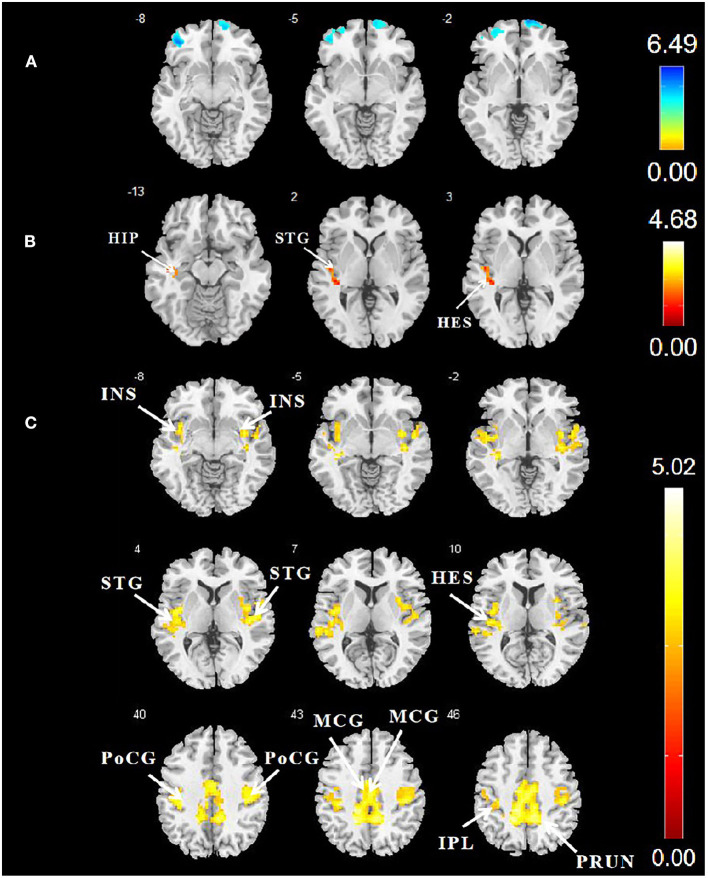
Figure 1.
(A) Differences in GMV between patients with early-onset T2DM and HCs. AlphaSim correction (5,000 simulations, voxel p = 0.001, and cluster size ≥ 586 voxels). (B) Comparison of DC values between the two groups. Cluster-level FWE correction (p < 0.05, cluster size ≥ 80 voxels). (C) Comparison of FC values between the two groups. Cluster-level FWE correction (p < 0.05, cluster size ≥ 90 voxels). The color bar denotes the t-value. GMV, gray matter volume; T2DM, type 2 diabetes mellitus; HCs, healthy controls; DC, degree centrality; FWE, familywise error; FC, functional connectivity.

