
Figure 2.
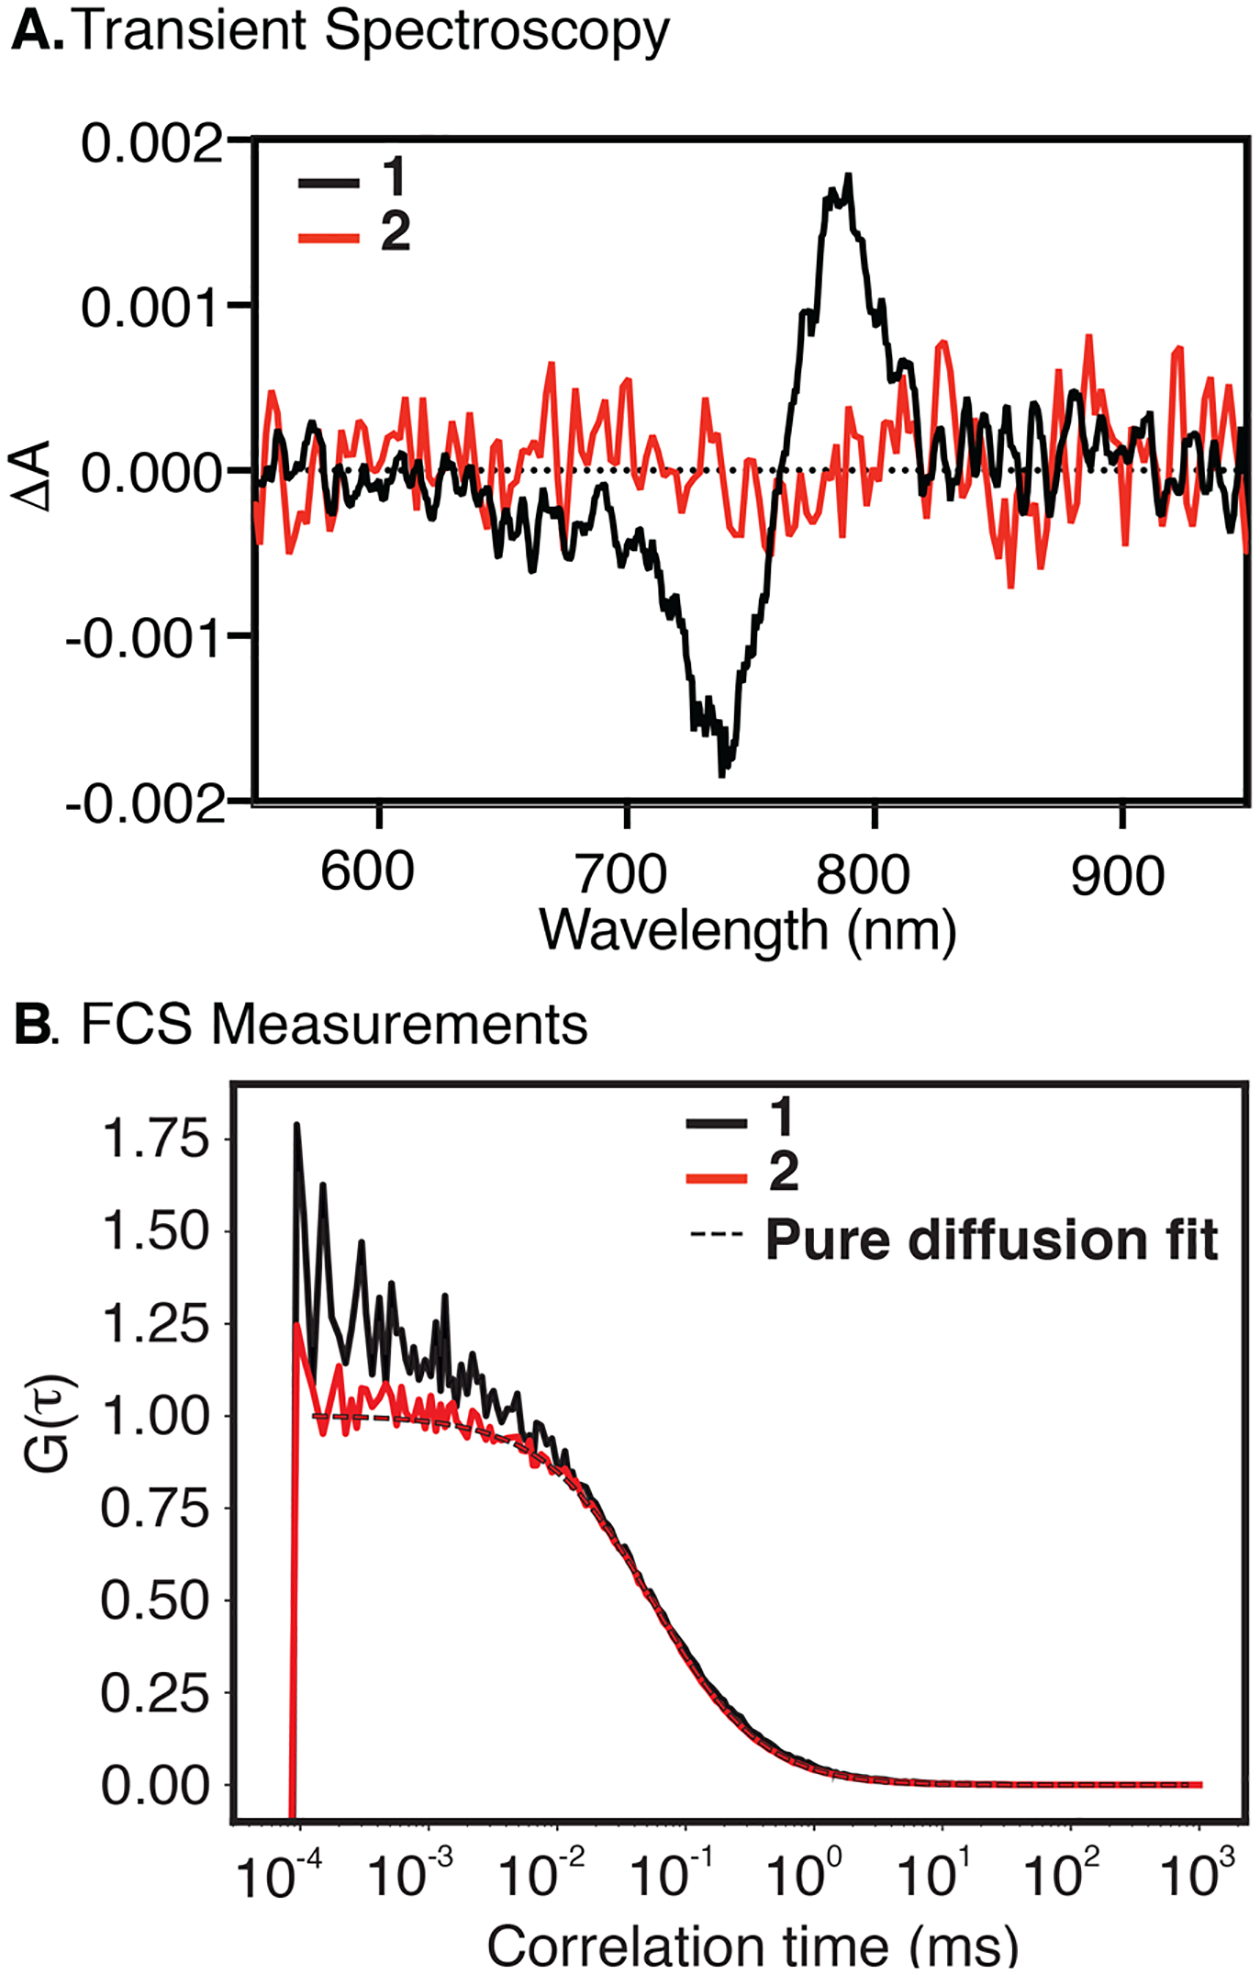
Transient difference spectrum (A, in ethanol) recorded 50 ns after excitation. FCS (B, in aqueous buffer containing ROXS photostabilization system)22 measurements of 1 and 2. The FCS curve of 2 can be described by pure diffusion fit, while in the FCS curve of 1, we observed an additional component in the microsecond timescale which we attribute to a photoisomerization.