
FIGURE 1.
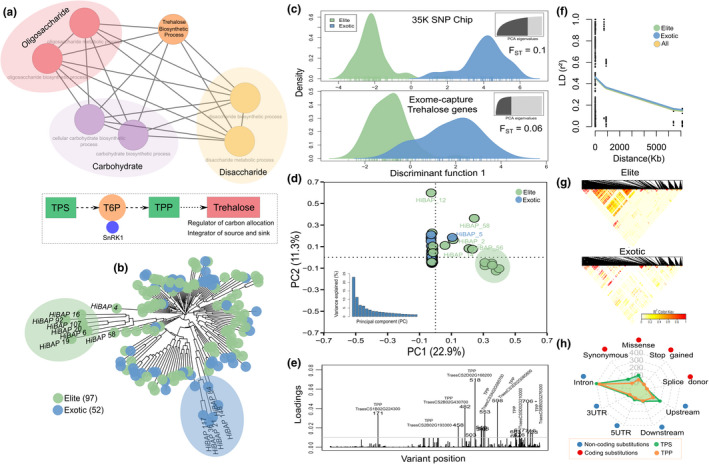
Population structure analysis using the exome capture data in the wheat HiBAP panel. (a) Gene ontology network and summary of the trehalose biosynthetic pathway. The same colour nodes represent similar biological processes. Trehalose phosphate synthase (TPS), trehalose 6‐phosphate (T6P) and trehalose phosphate phosphatase (TPP). (b) Neighbour‐joining tree (NJT) based on Euclidean distance where each colour represents a group. Group clustering was determined by Molero et al., (2019). (c) Density of individuals from a single discriminant function using the 35 K SNP Chip and exome capture data. Dark grey colour on the top right is the number of principal components (PC) retained for the discriminant analysis (DA). F ST values are shown inside the plots. (d) First two PCs using exome data coloured by groups. Bottom left plot represents the variance explained by the first twenty PCs. (e) Contributions (loadings) of each gene variant to the DA function. (f) Pattern of linkage disequilibrium (LD) decay among all pairs of genetic variants for the complete set of individuals (all), elite and exotic materials. Values reported are the average squared correlations (r 2) across all genes. (g) LD heatmap of the gene variants for elite and exotic subgroups. The colour gradient scale represents the range of r 2 values. Black represents the highest estimates of LD. (h) Radar plot showing the distribution of Variant Effect Predictor (VEP) consequences (five non‐coding and four coding substitutions) for the trehalose phosphate synthase (TPS) and trehalose phosphate phosphatase (TPP) gene family