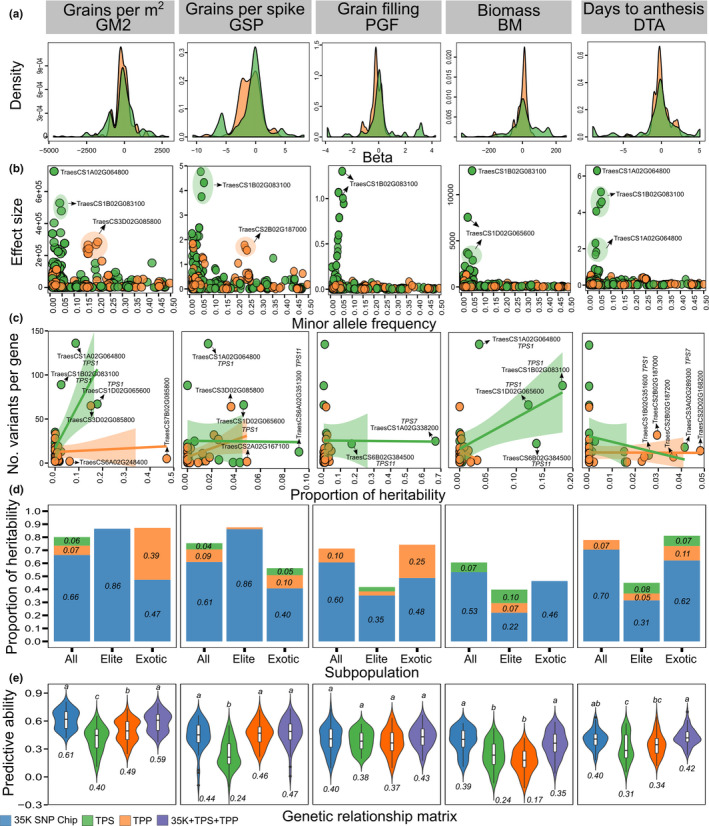
FIGURE 5.

Genetic architecture of complex traits using exome capture data of trehalose genes in the wheat HiBAP panel. Gene families are trehalose phosphate synthase (TPS) and trehalose phosphate phosphatase (TPP). (a) Estimate of the density distribution of regression coefficients (betas). (b) Association between effect size (ES) and minor allele frequency (MAF). (c) Association between the number of variants and the proportion of heritability per gene. Some genes are shown by black arrows. (d) Proportion of heritability in the complete set, elite and exotic subgroups. (e) Predictive ability based on genome‐wide markers, single gene family and combined effects. Numbers inside plots represent the mean from 50 random cross‐validations. Different letters above violin plots indicate significant differences at α = 0.05 from Tukey's test. Genome‐wide markers represent the 35 K Affymetrix Axiom® HD wheat array. Traits are grains per m2 (GM2), grains per spike (GSP, number), percentage of grain filling (PGF), final biomass (BM, g/m2) and days to anthesis (DTA, days)
