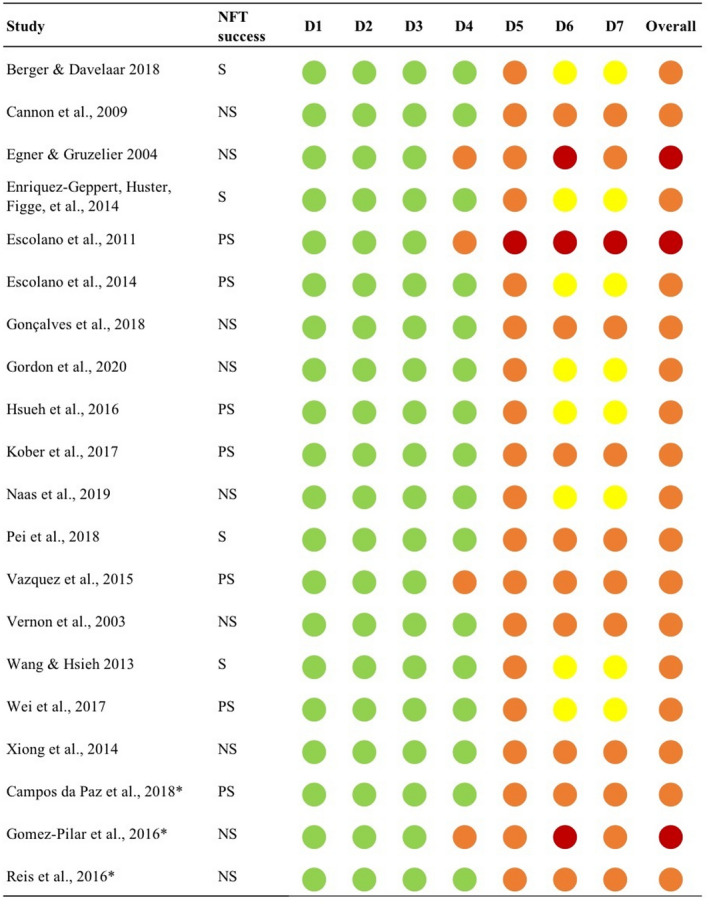
FIGURE 2.

Risk of bias assessment with ROBINS–I (Sterne et al., 2016). The risk ok bias of each study in the seven domains was evaluated and then the overall risk of bias judgment was formulated. Notes: D1, bias due to confounding; D2, bias in selection of participants into the study; D3, bias in classification of interventions; D4, bias due to deviations from intended interventions; D5, bias due to missing data; D6, bias in measurement of outcomes; D7, bias in selections of the reported results; green, low risk of bias; yellow, moderate risk of bias; orange, serious risk of bias; red, critical risk of bias. * = Studies with older adults only
