FIGURE 3.

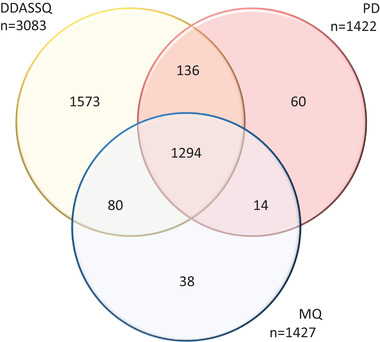
(A) Venn diagram showing the intersection of LFQ protein accessions quantified by DDASSQ, MaxQuant (MQ) and Proteome Discoverer (PD)

(A) Venn diagram showing the intersection of LFQ protein accessions quantified by DDASSQ, MaxQuant (MQ) and Proteome Discoverer (PD)