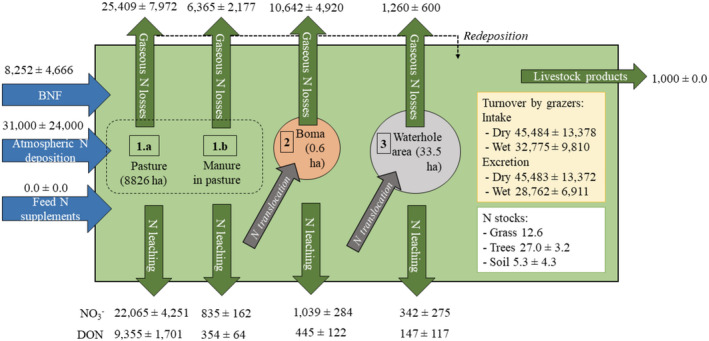
Fig. 1.

Nitrogen flows (kg N/yr) and stocks (kg N/ha) calculated for a virtual farm of 10,000 ha. Simplified scheme (not to scale) showing N dynamics in pastoral systems in sub‐Saharan Africa. The system area is represented in light green. The area comprises the pasture (1.a) and the urine/feces therein (1.b, in dark brown), the bomas (2, in light brown) and the piosphere (3, in light blue). N flows are represented with arrows (N inputs blue arrows; N outputs red arrows; internal N translocations with green arrows, e.g., from the pasture (1.a) to congregation areas. Some of the NH3 can be redeposited into the system (dotted arrow). Vegetation and soil N stocks (white box) are included in the budget, and turnover of N by grazers (i.e., intake and excretion, yellow box) are used for N fluxes calculations. BNF stands for biological nitrogen fixation.
