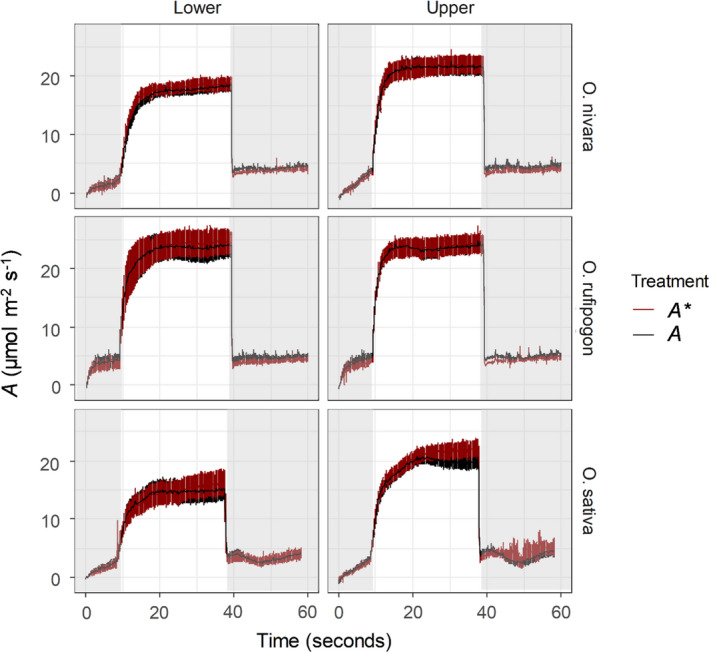
FIGURE 8.

The response of uncorrected leaf CO2 uptake (A; ●) and the response of leaf CO2 uptake corrected for stomatal limitation (A*
;  ) over time in different rice species and canopy levels. The vertical line indicates the mean time for the activation of Rubisco (τ) per accession. Each point represents the mean of 6 plants SE (n = 6)
