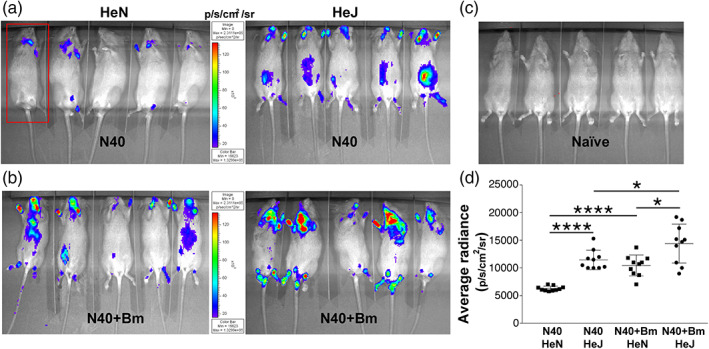
FIGURE 2.

Colonisation of organs by B. burgdorferi in C3H/HeJ and C3H/HeN mice infected with N40 alone and co‐infected with Bm at 2 weeks of infection. (a) Representative real‐time images of five C3H/HeJ (HeJ) and C3H/HeN (HeN) mice infected with bioluminescent N40 strain using IVIS‐200 displaying bioluminescence as a semi‐quantitative indicator of B. burgdorferi colonisation in different tissues of mice. Bioluminescence radiance in the whole body of each mouse (as marked in one mouse by a red rectangle) was also measured. (b) Overall, light emission in five mice each, representing colonisation of organs and spirochetal burden in co‐infected C3H/HeJ and C3H/HeN mice at 2 weeks post‐infection. (c) A set of five uninfected mice was also imaged at the same time with average bioluminescence radiance measured to be (483.23 p/s/cm2/sr). (d) Average bioluminescence radiance from five uninfected mice was deducted from the radiance obtained for each infected mouse (as marked in 2a and 2b) and net radiance values data for 10 mice for each infection is presented. Horizontal lines indicate the net mean radiance in each group of infected mice. Statistical analysis was conducted using a two‐tailed unpaired student t tests for unequal variance to determine significant difference between the paired groups (*p < .05, ****p < .0001)
