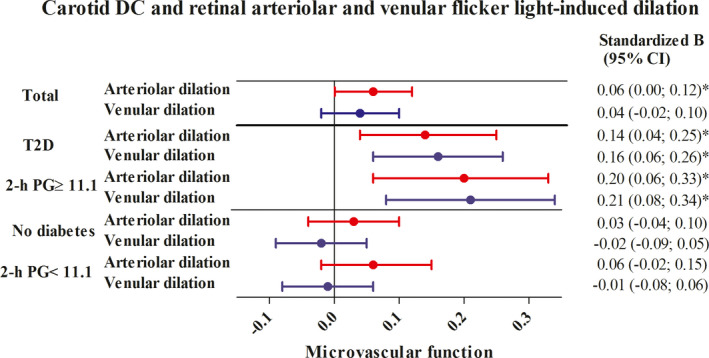
FIGURE 2.

Associations between carotid DC (per SD) and retinal arteriolar and venular flicker light‐induced dilation (per SD). Standardized regression coefficient (stβ) represents the difference in arteriolar or venular dilation in SD per SD greater carotid DC. In the total population, 1 SD corresponds with 5.14 × 10⁻³/kPa for carotid DC, 2.82% for flicker light‐induced arteriolar dilation, and 2.20% for flicker light‐induced venular dilation. In participants with type 2 diabetes, 1 SD corresponds with 4.8 × 10⁻³/kPa for carotid DC, 2.7% for flicker light‐induced arteriolar dilation, and 2.3% for flicker light‐induced venular dilation in participants without diabetes. In participants without diabetes 1 SD corresponds with 5.2 × 10⁻³/kPa for carotid DC, 2.9% for flicker light‐induced arteriolar dilation, and 2.2% for flicker light‐induced venular dilation. For participants with higher and lower levels of 2‐h PG (≥11.1 mmol/L vs. <11.1), values per SD were quantitatively similar to values per SD for participants with type 2 diabetes and without diabetes, respectively. Variables in model in addition to carotid DC: age, sex, and glucose metabolism status, mean arterial pressure and heart rate, smoking status, alcohol consumption, waist circumference, total‐to‐high density lipoprotein cholesterol ratio, lipid‐modifying and antihypertensive medication, educational status. In stratified analyses, glucose metabolism status was not included in the model. *Indicates statistically significant (p < .05). 2‐h PG, 2‐h post‐load glucose; CI, confidence interval; DC, distensibility coefficient; SD, standard deviation; T2D, type 2 diabetes
