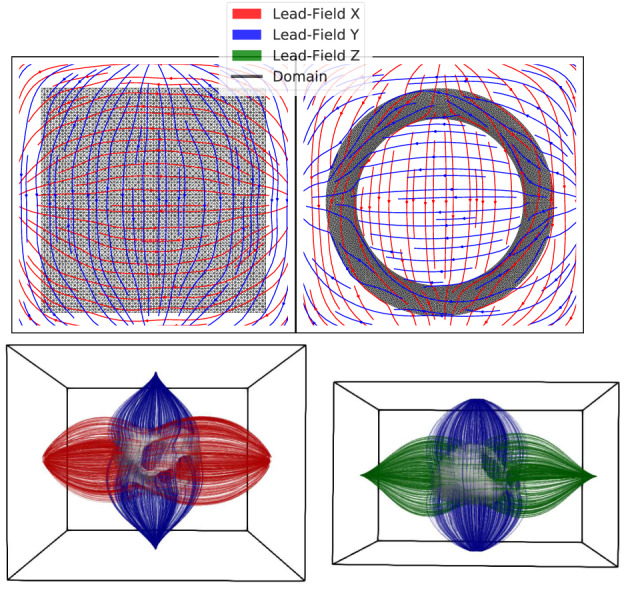
FIGURE 14.

Setup for the ECG experiments showing the torso domain . The heart domain is indicated by black lines for the 2D experiments and gray silhouettes for 3D. The streamlines visualize the lead fields. Note that the lead field for axis Z (green) is only present in the 3D experiments
