FIGURE 15.

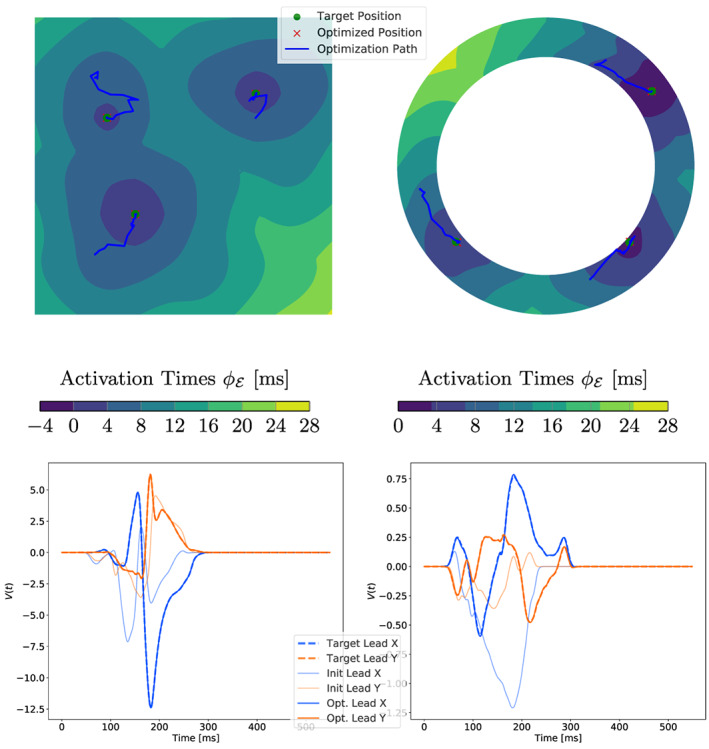
Results of the 2D ECG optimization. Top row: temporal change of the positions of the EASs along with the ground truth. Bottom row: initial, final and target ECG for fitting

Results of the 2D ECG optimization. Top row: temporal change of the positions of the EASs along with the ground truth. Bottom row: initial, final and target ECG for fitting