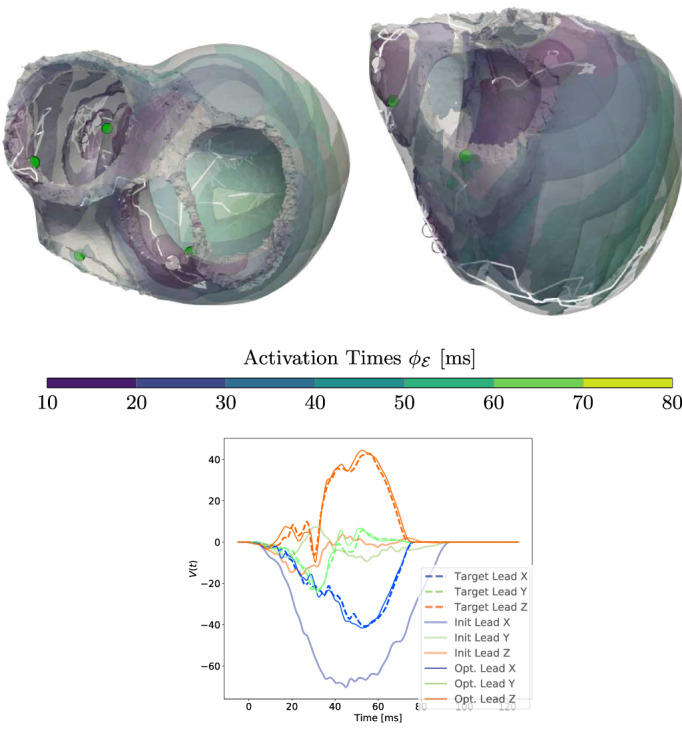
FIGURE 16.

Results of the ECG optimization on the trifascicular model. Top row: optimized positions of EASs (white circles) along with temporal changes over the iterations (white lines). The green circles represent the target position from which the ground truth was generated. Bottom row: initial, final and target ECG
