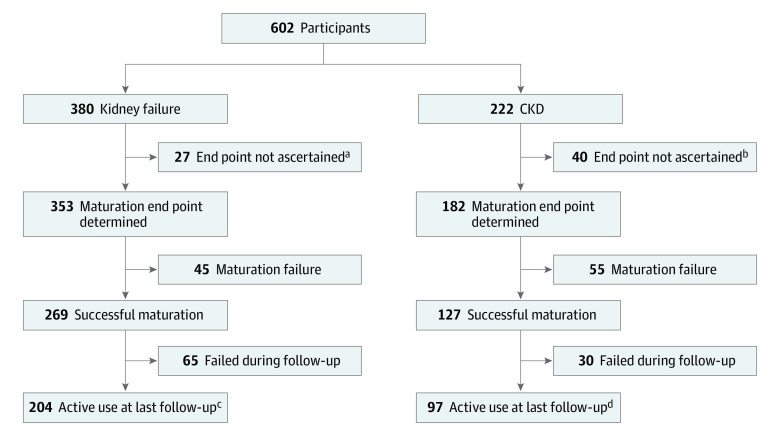
Figure 1. Flow Diagram of the Participants.
A flow diagram of the participants enrolled in the study, as categorized by their initial dialysis status (kidney failure vs chronic kidney disease [CKD]), is shown for the autogenous arteriovenous fistula (AVFs) that were ascertained, the AVFs that matured, and the AVFs that were used for dialysis until abandonment.
aDeath (n = 19), alternative dialysis modality (n = 3), lost to follow-up (n = 5).
bDeath (n = 8), alternative dialysis modality (n = 6), lost to follow-up (n = 2), never started dialysis (n = 24).
cMedian follow-up, 26 months (interquartile range, 17-37 months).
dMedian follow-up, 28 months (interquartile range, 18-39 months).

