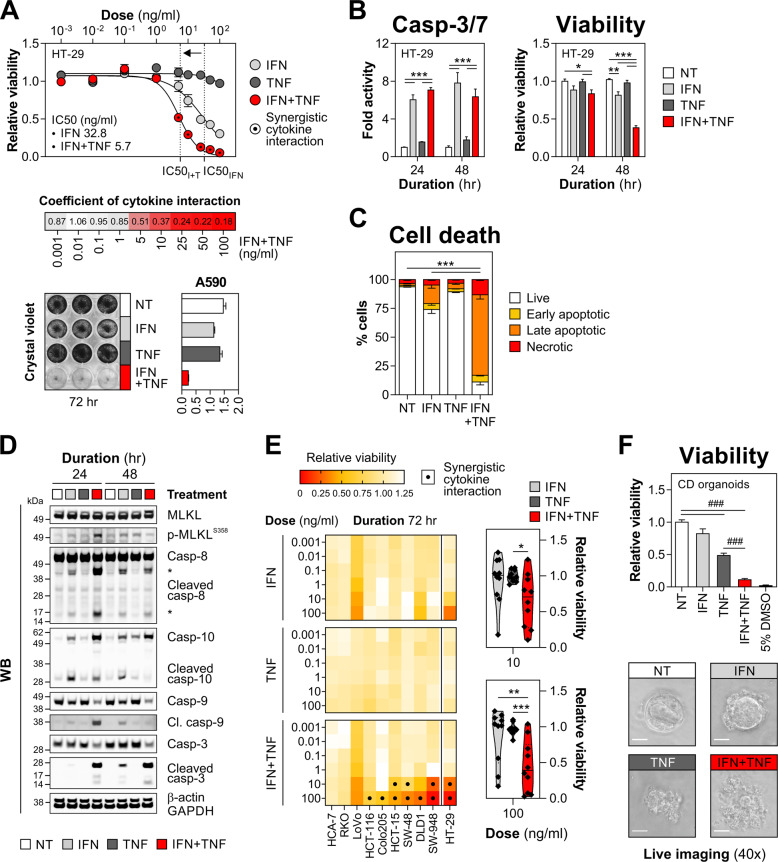
Fig. 1. IFN-γ synergises with TNF-α to kill IECs in a dose-dependent manner.
A HT-29 cells were treated with increasing concentrations of IFN-γ and/or TNF-α for 72 h. Relative viability, including absolute IC50 values (top) and a heat map of viability-based coefficients of cytokine interaction (middle). Crystal violet staining and its absorbance quantification (A590 nm) at 10 ng/ml cytokine dose (bottom). B–D HT-29 cells were treated with IFN-γ and/or TNF-α (10 ng/ml each) for the indicated times. B Caspase-3/7 activity and relative viability of HT-29 cells measured at 24 and 48 h. C HT-29 cells were stained for active caspase-3 and fixable viability dye FVS660 at 72 h, analysed by flow cytometry and percentages of live/dying cells were quantified. Data were mean ± SEM of n = 2 independent experiments. D Western blots showing levels of MLKL (total and S358-phosphorylated) and CASP3/8/9/10 (total and cleaved) in HT-29 cells treated as indicated for 24 and 48 h. E Colonic cell lines were treated with increasing concentrations of IFN-γ and/or TNF-α for 72 h. Heat maps showing relative viability in each line (left) and a combined viability score across the cell line panel (including HT-29 data, extracted from section (A)) for the indicated cytokine doses (right). F Primary human colonic organoids derived from Crohn’s disease (CD) colonic biopsies (n = 3 lines) were treated with IFN-γ and/or TNF-α (10 ng/ml each) or 5% DMSO for 72 h. Relative viability (top) and representative live images of a select organoid line (bottom). Unless specified otherwise, data were mean ± SEM of n = 3 independent experiments. *p < 0.05, **p < 0.01 and ***p < 0.001 (two-way ANOVA with Tukey’s multiple comparisons test), ###p < 0.001 (one-way ANOVA with Tukey’s multiple comparisons). NT non-treated.

