
FIGURE 2.
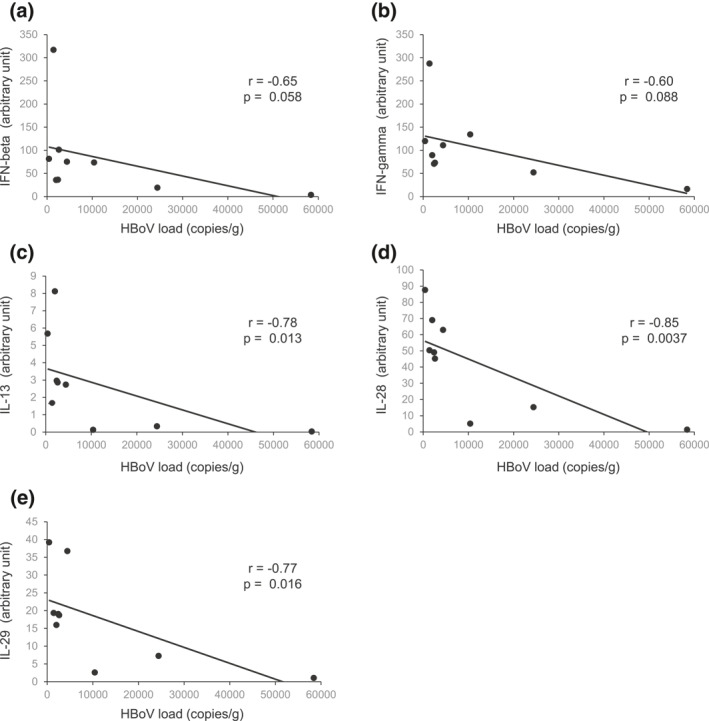
(A–E) Correlations between intratonsillar HBoV1‐DNA loads and cytokine expressions. The HBoV1 DNA load (x‐axis) is presented as copies/g and the cytokine expressions (y‐axis) as arbitrary units × 104 relative to EF1α
Official websites use .gov
A
.gov website belongs to an official
government organization in the United States.
Secure .gov websites use HTTPS
A lock (
) or https:// means you've safely
connected to the .gov website. Share sensitive
information only on official, secure websites.
(A–E) Correlations between intratonsillar HBoV1‐DNA loads and cytokine expressions. The HBoV1 DNA load (x‐axis) is presented as copies/g and the cytokine expressions (y‐axis) as arbitrary units × 104 relative to EF1α