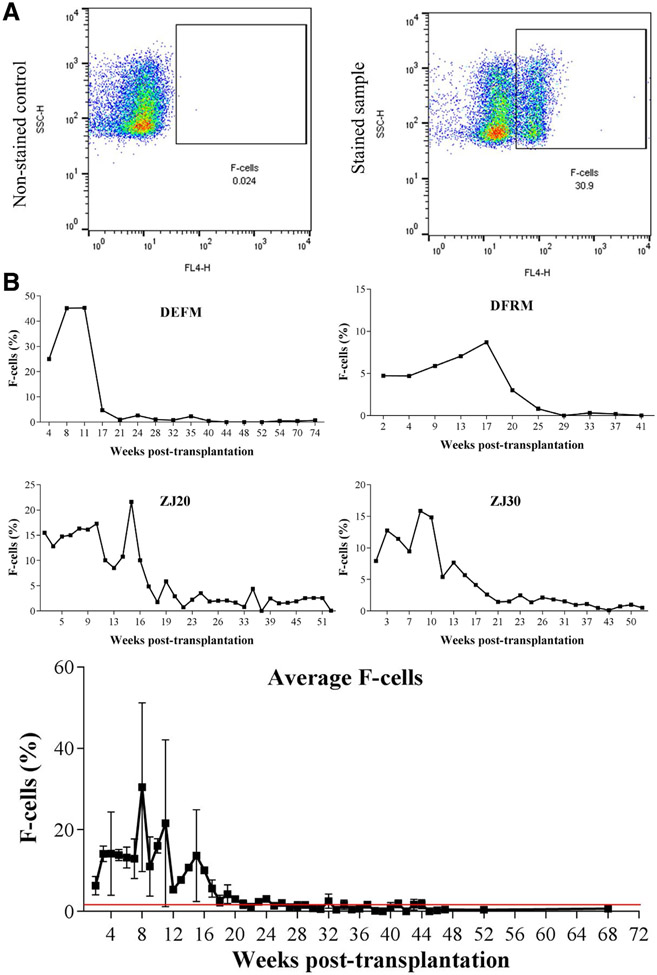
Figure 2.
(A) Representative flow plots of non-stained and stained samples revealing the gating strategy for F-cell analysis by flow cytometry. (B) F-Cell ratios in total body irradiated (DEFM, DFRM, ZJ20 and ZJ30) rhesus monkeys (Macaca mulatta) transplanted with CD34+ cells. The results were analyzed with FlowJo V10 software. The average F-cell ratio determined from 31 non-transplanted control animals (1.96 ± 1.97%) is represented by the red line.

