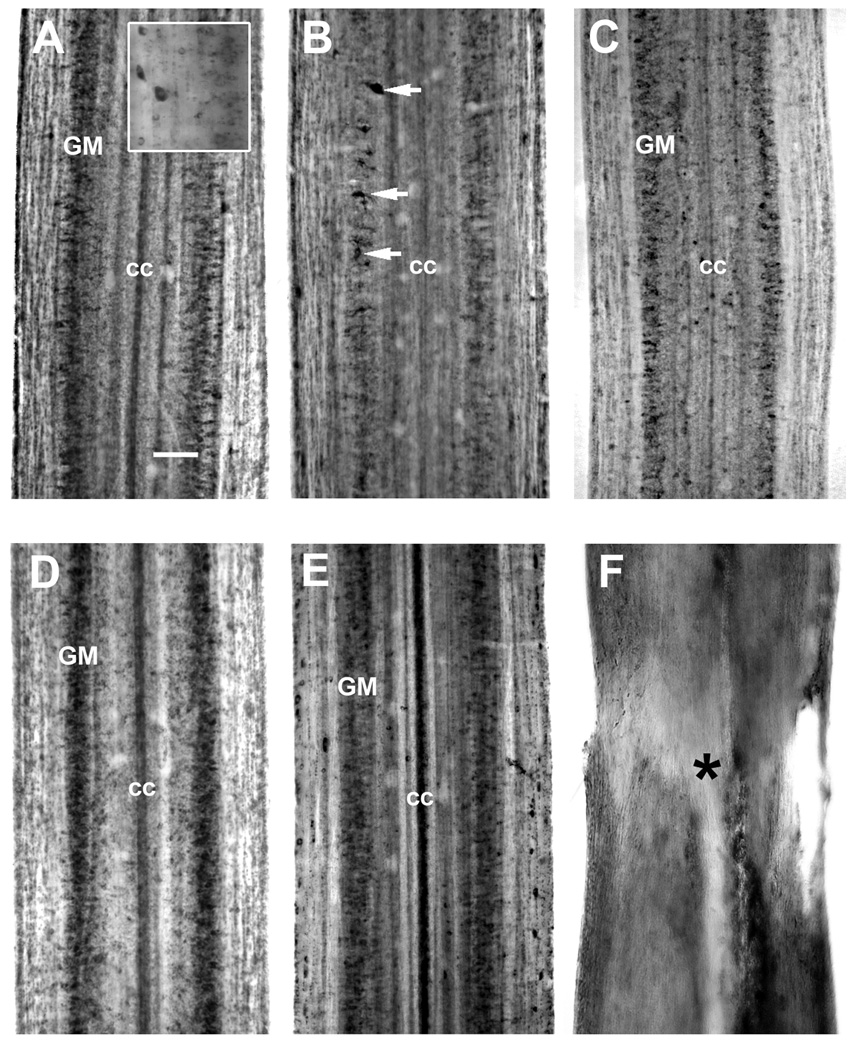
Figure 2. Expression of neurotrophin mRNA in the spinal cord after transection.
In situ hybridization was performed in spinal cord wholemounts. Rostral is top in all micrographs. The entire width of the cord is seen. A, in situ hybridization in wholemounted control spinal cord shows moderate intensity labeling for lamprey neurotrophin (NT) in the medium size neurons of the spinal gray matter (GM). The ependymal cells lining the central canal (cc) may also express NT. Insert – high magnification of NT-expressing neurons. B and C. NT mRNA expression 14 days after spinal cord transection. NT mRNA expression was downregulated up to 10 mm rostral (B) and caudal (C) to transection in the neurons of the spinal gray matter (GM). While some cells (white arrows) continued expressing of NT mRNA, many other cells stopped expressing it. Downregulation of NT mRNA expression was more prominent in spinal cord rostral to transection. D and E. By four weeks post-transection, NT mRNA expressing neurons of the spinal gray matter (GM) were found both rostral (D) and caudal (E) to the transection site and expression was upregulated in rostral part near the lesion site compared to control animals (A). The intensity of labeling was also above control levels up to 10 mm caudal to the transection. cc – central canal. F. The absence of NT mRNA hybridization signal in the transection zone after SCI. The transection site (asterisk) was easily identified in wholemount spinal cord preparations by the narrowing of the spinal cord and widening of the central canal. High background seen on these frames (B – F) is due to nonspecific binding of label to cellular debris and blood cells entering the transection site. Scale bar, 100 µm (A).

